Tag Archives: Productivity

The Unbearable Sameness of Online Meetings

Have you been working from home since March? Are you enjoying it or are you missing your old workplace? Are you are also starting to notice a monotony that seems to lead to mild memory confusion? I am. In this post, I want to explore how and why doing everything online might make it harder to keep things straight.

In 2020, many of us learned to work from home. The novel coronavirus that caused COVID-19 also caused a shift in how a lot of us worked. Across the world, many teachers, tech workers, knowledge workers, people in media, and people in business began working from home and began holding meetings on video meeting platforms like Zoom, Skype, or MS Teams. For many of us, it represented a significant shift in how we did our work, even though much of the content work stayed the same.

At first this was as novel as anything else. I liked writing from home, and I converted the spare bedroom into an office.

My converted spare room home office and near-constant companion, Peppermint the cat.

Great, I thought. We’ll get through this. More than 7 months later I’m not sure. There have been more than enough essays on Zoom fatigue, the challenges of spotty internet, tips for better meetings, and Zoom etiquette. I want to talk about something else. The unbearable sameness of online meetings and its effects on my memory.

Zoom Takes Over

Video meetings have been around for a while in academia, but the near total reliance on them in 2020 was unprecedented. We use our knowledge of the past to help guide our behaviour in new situations. But for this, I had few prior memories available to guide me. What I did have to guide me were my usual routines, like weekly lab meetings and weekly advisory meeting with my students. So that’s how I began to structure my online day. It was similar to my pre-pandemic workday, just using video meetings in place of face-to-face meeting.

I began to teach online using Zoom for student meetings and recording lecture videos. I meet weekly with my graduate students online on Zoom. We hold weekly lab meetings on Zoom. We hold department meetings on Zoom. We have PhD defences and masters thesis defences on Zoom. There are formal Zoom talks and informal zoom coffee breaks. Some people even have Zoom happy hours. Even academic conferences, which have long been a way for academics, researchers, students and scientists to come together from different locations switched to online formats. Soon, I was doing all my work—all my teaching, research, committee work, and mentoring—from the same screen on the same computer in the same room.

Memory Errors

Although a lot of my research and teaching work is able to carried out at home and online, I began to notice some small changes. Not just general fatigue, though that’s also a concern. I was making more simple memory errors (more than usual). For example, I might be talking with one student for 10 minutes about the wrong project. Or I might confuse one meeting for another. A lot of these mistakes were source memory errors. I remembered the student, a topic, and the meeting, but confused which one was which. I was more like the stereotype of the “absent minded professor” than I used to be.

Then I realized a possible source for the problem: Everything looked the same. I was looking at the same screen on the same computer in the same room for everything. This was not typical. For my entire career as an academic, there have always been different places for different activities. I would lecture in a lecture hall or classroom. I would hold seminars in a small discussion room. I would meet with students in my office. I would meet with colleagues at the café on campus. Committee meetings were usually held in meeting rooms and board rooms. I would work on data analyses in my office. I would usually write at home or sometimes in a local café. Different places for different tasks. But now, all the work was in one place. Teaching, research, writing, and advising were all online. And worse, it all looked the same. It was all on the same screen, on Zoom, and in my home office. I no longer had the variety of space, time, location, and context to create a varied set of memory cues.

Location Based Memory

Memory is flexible and our memory depends on spreading activation to activate similar memories. In some cases, local context can be a strong and helpful memory cue. If you encode some information in one context, you will often remember that information better in the same context. Memory retrieval depends on a connection between the cues that were present at encoding and the cues that were present at retrieval. This is how we know how to adjust our behaviour in different contexts.

We react to locations all the time. When you walk into a restaurant or diner, you probably adjust your behaviour. If you are returning to a restaurant that you were at years ago, you will remember having been there before. Students behave differently in class than out of class. Being in specific place helps you remember things that you associated with that place. This is all part of our natural tendency to remember things where and when they are likely to matter most.

But it seemed like this natural tendency was working against me. Each day began and ended at the desk in my home office. Each day I was in the same location when I taught, wrote, met, and carried out analyses. But this was also the same location where I read the news, caught up on Twitter, and ordered groceries online. What I noticed in my new forgetfulness was that I was experiencing memory interference. Everything was starting to look the same. The contextual cues that would normally be a helpful reminder of what I was doing were no longer working as memory cues because they were the same cues for everything and everyone. When everything looks the same, context is no longer a helpful memory cue. If you work, meet, read, write, shop, and casually read the news in exactly the same place, the likelihood that you will make an error of confusion is increased. It’s not that I am forgetting things; It’s just that I am not always remembering the right things

What (if any) solutions?

This is not an easy problem to solve, of course, because as long as COVID is ascendant, I will still have to work from home. But I am trying a few things. One simple fix might be to vary my approach to video meetings. It might help to change platforms in a consistent way, say by meeting with one working group on MS Teams and another on Zoom. It’s not as strong of a difference as meeting in different rooms, but it’s still a change of venue. Another way to accomplish the same goal is to simply change the appearance of my computer each time you meet with a person, use different backgrounds for different people, or light view for “work”, dark view for “home”. These seem like very small things and they might not fix the problem entirely, but they could help.

I thought about working in my university office, maybe once a week, and do my Zoom-based grad advisory meetings that way. Maybe that will help create a good context cue. Though I have to say, I like my home office setup with my cat, no driving commute, and unlimited coffee. The other issue with working on campus is that if we have another lockdown, I have to start over again from home. I really want to make it work from home. I need to find new ways to work, not try to work the old way.

I’m willing to try different things to help bring some better sense of structure to my online life. Like it or not, this is how a lot of us are working now and for the foreseeable future.

I would be interested in hearing your suggestions and other ideas.

The Scientific Workflow: A Guide for Psychological Science

When new students or postdocs enter into your lab, do you have a plan or a guide for them? I have a lab manual that explains roles and responsibilities, but I did not (until recently) have a guide for how we actually do things. So I’ve made it my mission in 2019 and 2020 to write these things down and keep them updated. The Lab Manual (see above) is about roles and responsibility, mentorship, EDI principles, and lab culture.

This current guide, which I call the Scientific Workflow, is my guide for doing psychological science.  I wrote this to help my own trainees after a lab meeting last where we discussed ideas around managing our projects. It started as a simple list, and I’m now making it part of my lab manual. You can find a formatted version here, and the LaTex files here.

IMG_20191029_075744

Nothing related to science here, but a beautiful picture of campus from our research building

Introduction

This is my guide for carrying out cognitive psychology and cognitive science research in my lab. The workflow is specific to my lab, but can be adapted. If you think this is helpful, please feel free to share and adapt for your own use. You can keep this workflow in mind when you are planning, conducting, analyzing, and interpreting scientific work. You may notice two themes that seem to run throughout the plan: documenting and sharing. That’s the take home message: Document everything you do and share your work for feedback (with the group, your peers, the field, and the public). Not every project will follow this outline, but most will.

Theory & Reading

The first step is theory development and understanding the relationship of your work to the relevant literature. For example, my research is based in cognitive science and I develop and test theories about how the mind forms concepts and categories. My lab usually works from two primary theories. 1) Prototype / exemplar theory , which deals with category representations; and 2) multiple systems theory (COVIS is an example) which addresses the category learning process and rule use. I follow these topics on line and in the literature.

Screen Shot 2020-01-18 at 6.49.03 AM

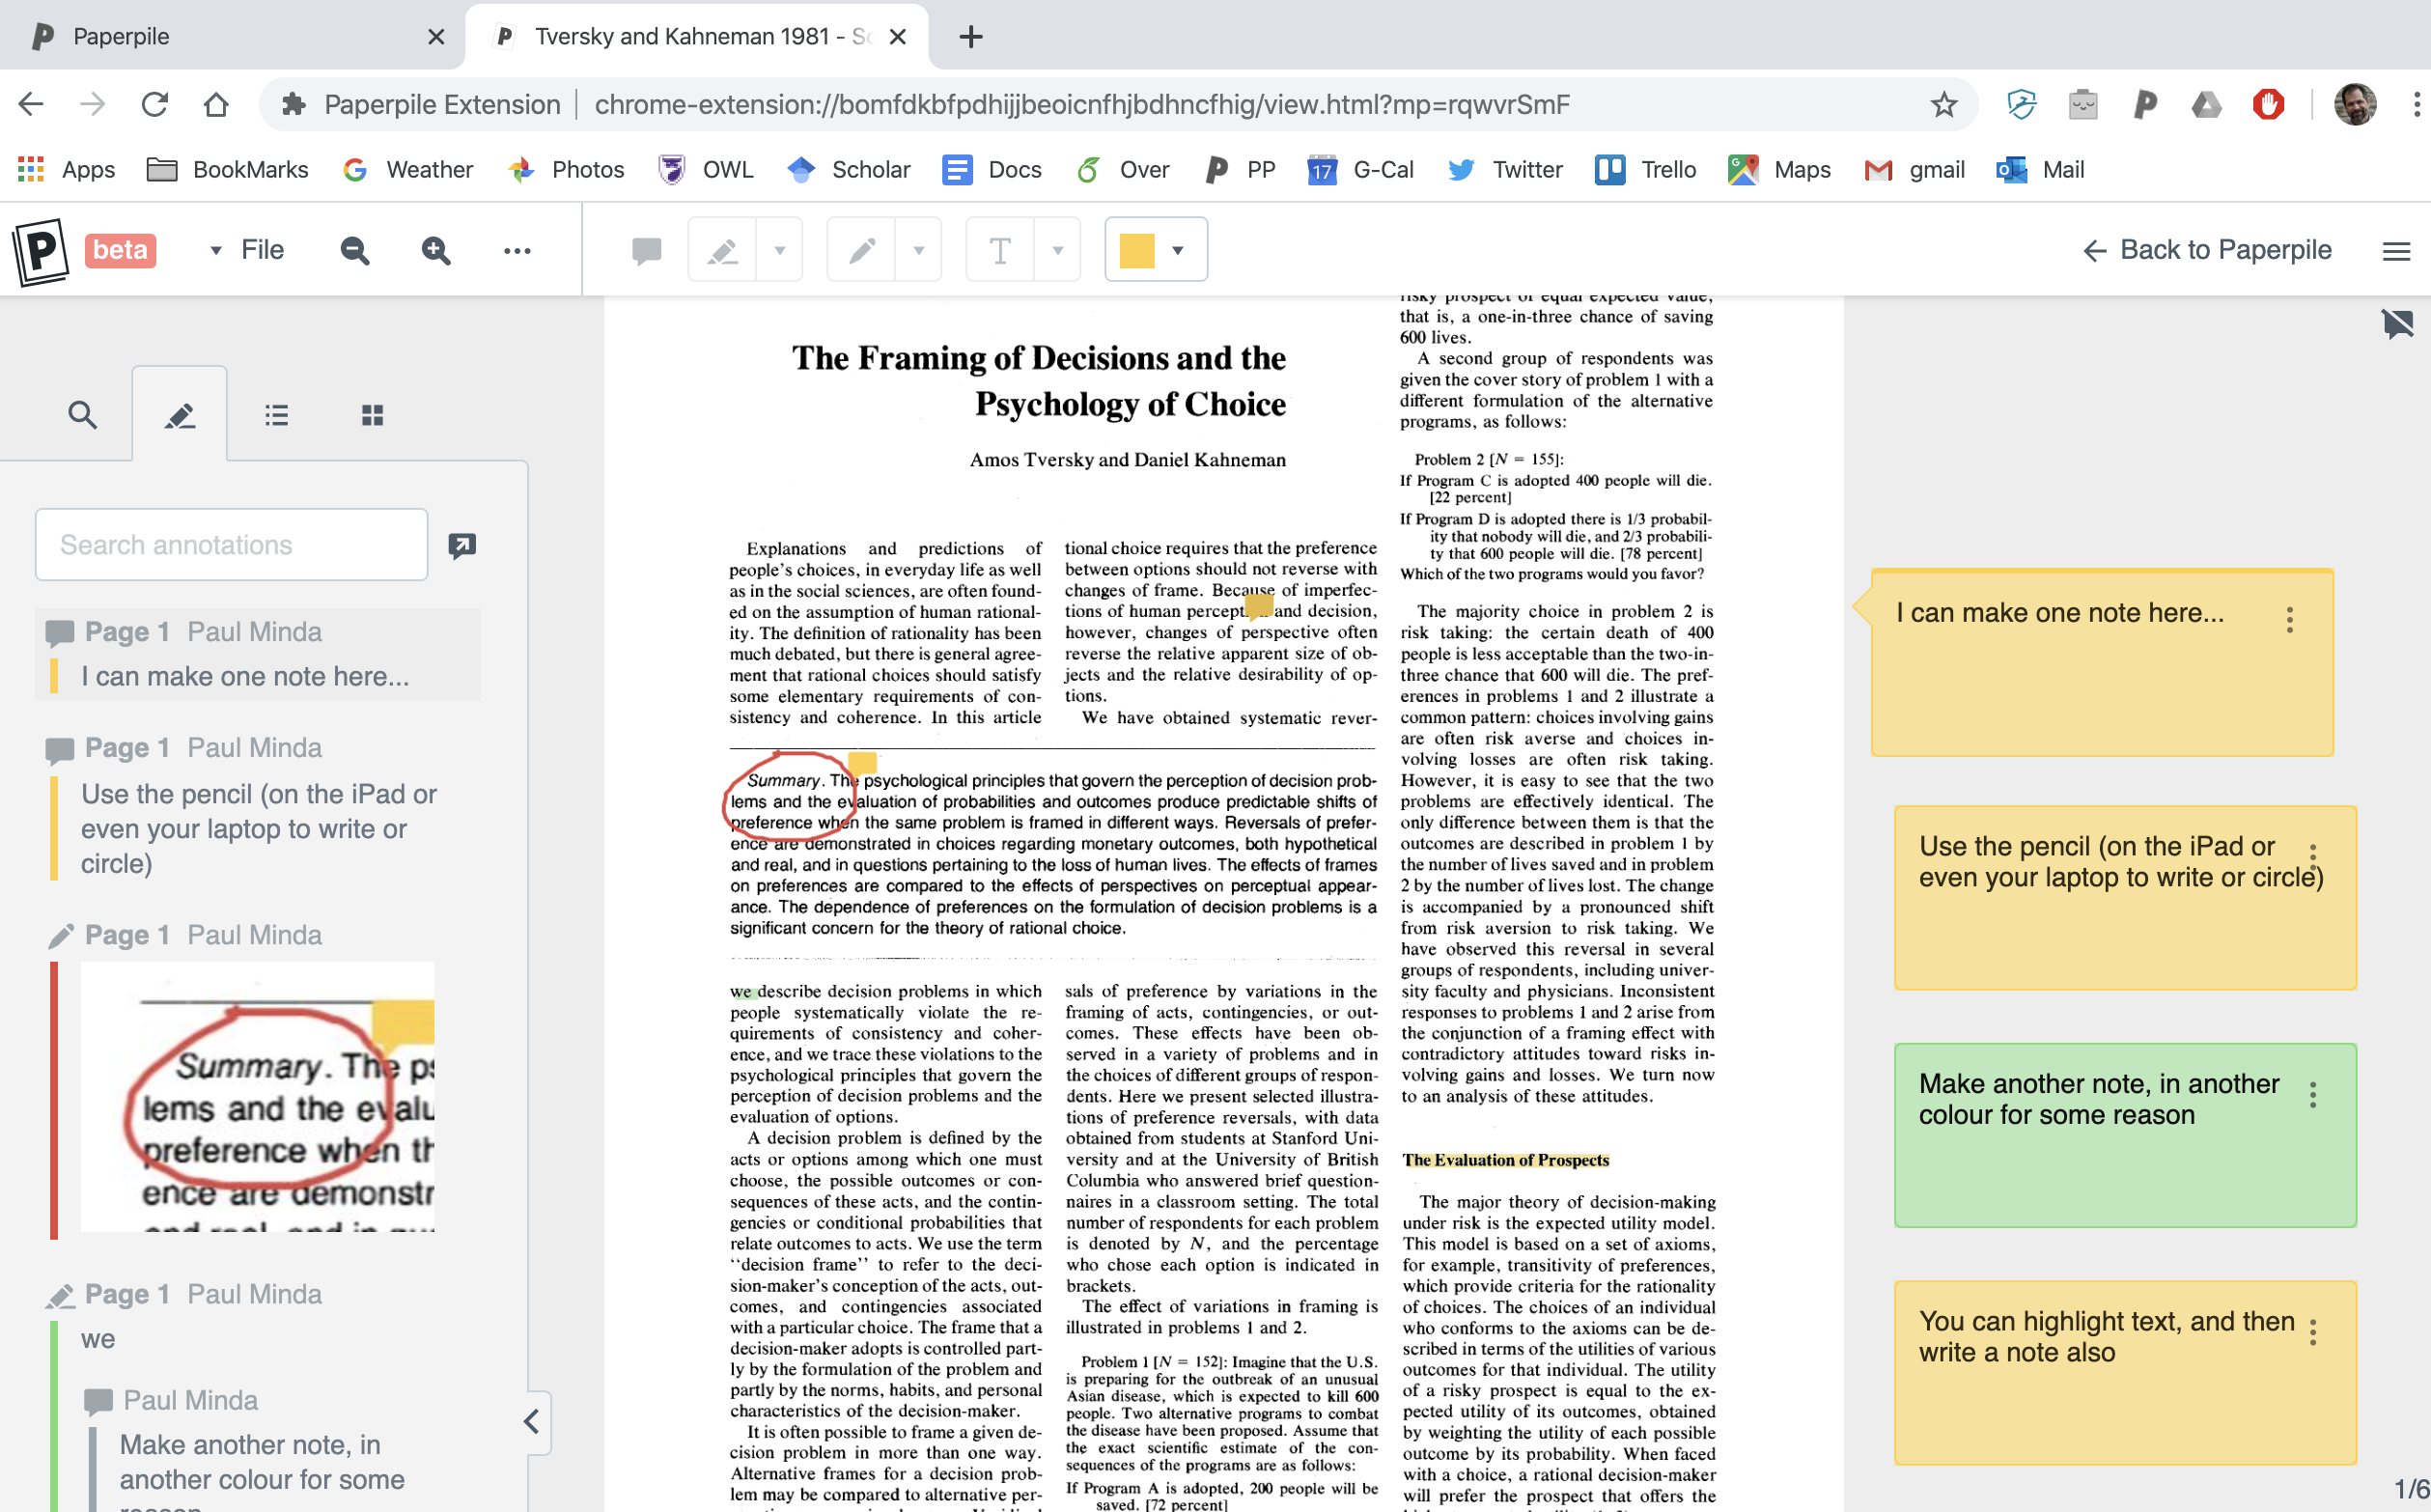
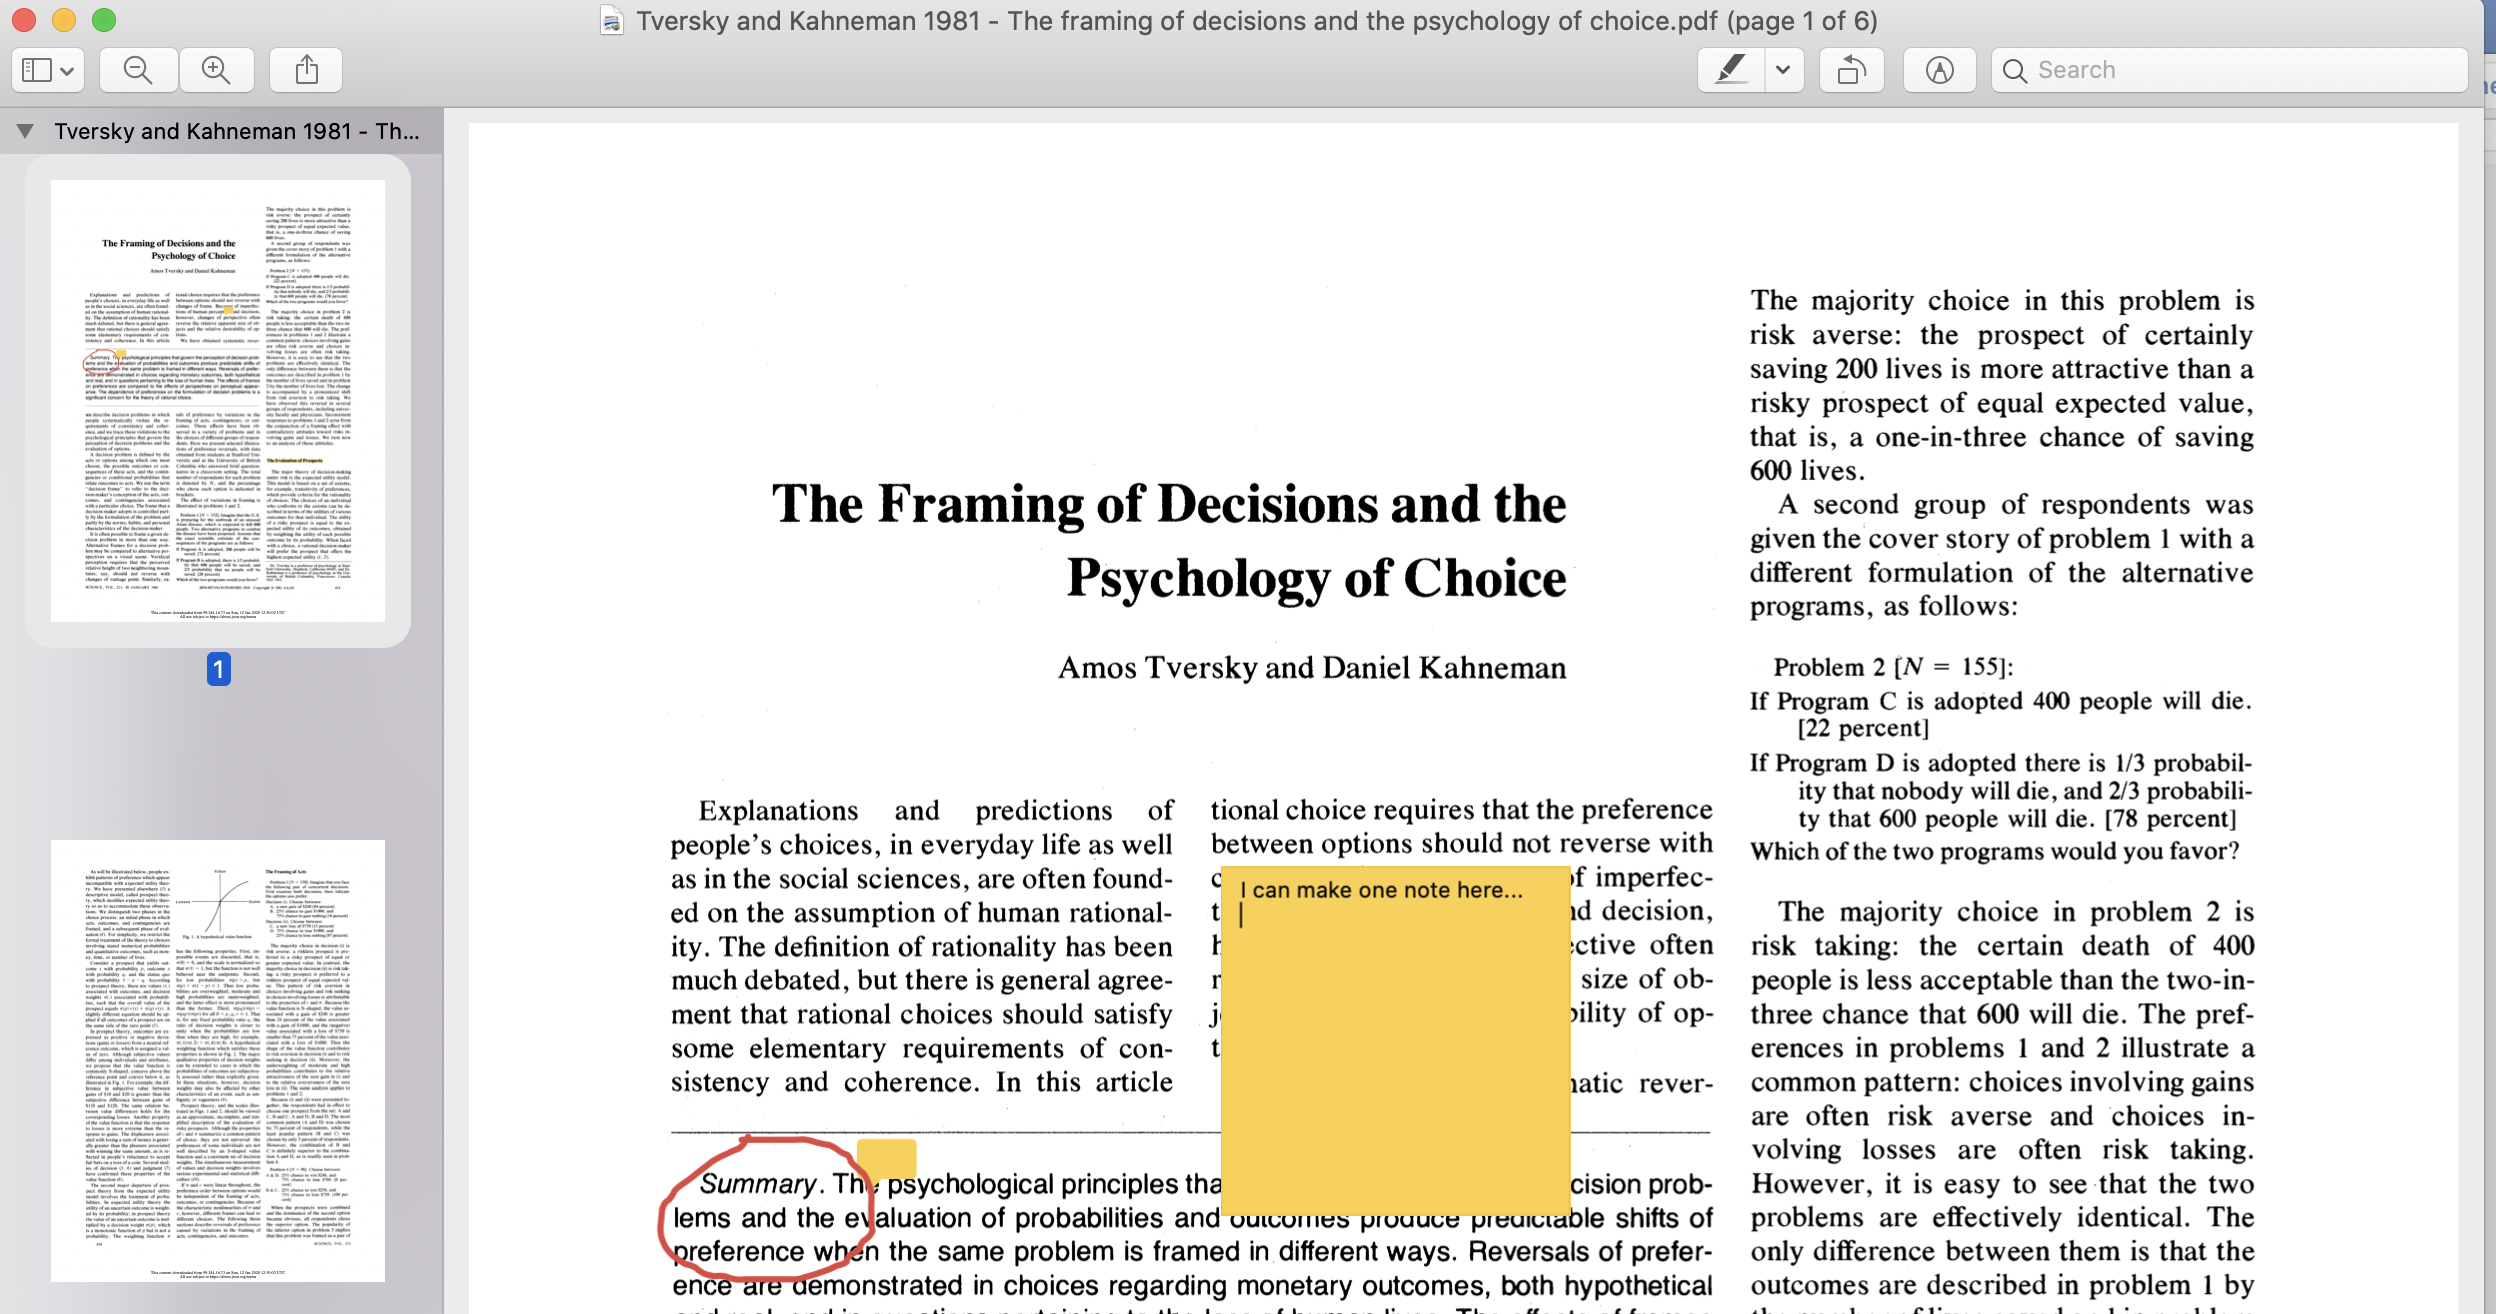
Paperpile is a great way to organize, annotate and share papers. See my article here.

You should keep up with developments in the field using Google Scholar alerts and its recommendations. I check every week and I recommend that you do as well. We want to test the assumptions of these theories, understand what they predict, test their limitations and contrast with alternative accounts. We’re going to design experiments that help understand the theory, the models, and make refinements and/or reject some aspects of our theories.

  • Use Google Scholar to find updates that are important for your research.
  • Save papers in Paperpile (or Zotero) and annotate as needed.
  • Document your work in Google Docs (or another note taking app).
  • Share interesting papers and preprints with the whole lab group in the relevant channel(s) in Slack.

Hypotheses Generation

Hypotheses are generated to test assumptions and aspects of the theory and to test predictions of other theories. The hypothesis is a formal statement of something that can be tested experimentally and these often arise from more general research questions which are often broad statements about what you are interested in or trying to discover. You might arrive at a research question or an idea while reading a paper, at a conference, while thinking about an observation you made, or by brainstorming in an informal group or lab meeting.

IMG_20190529_095011

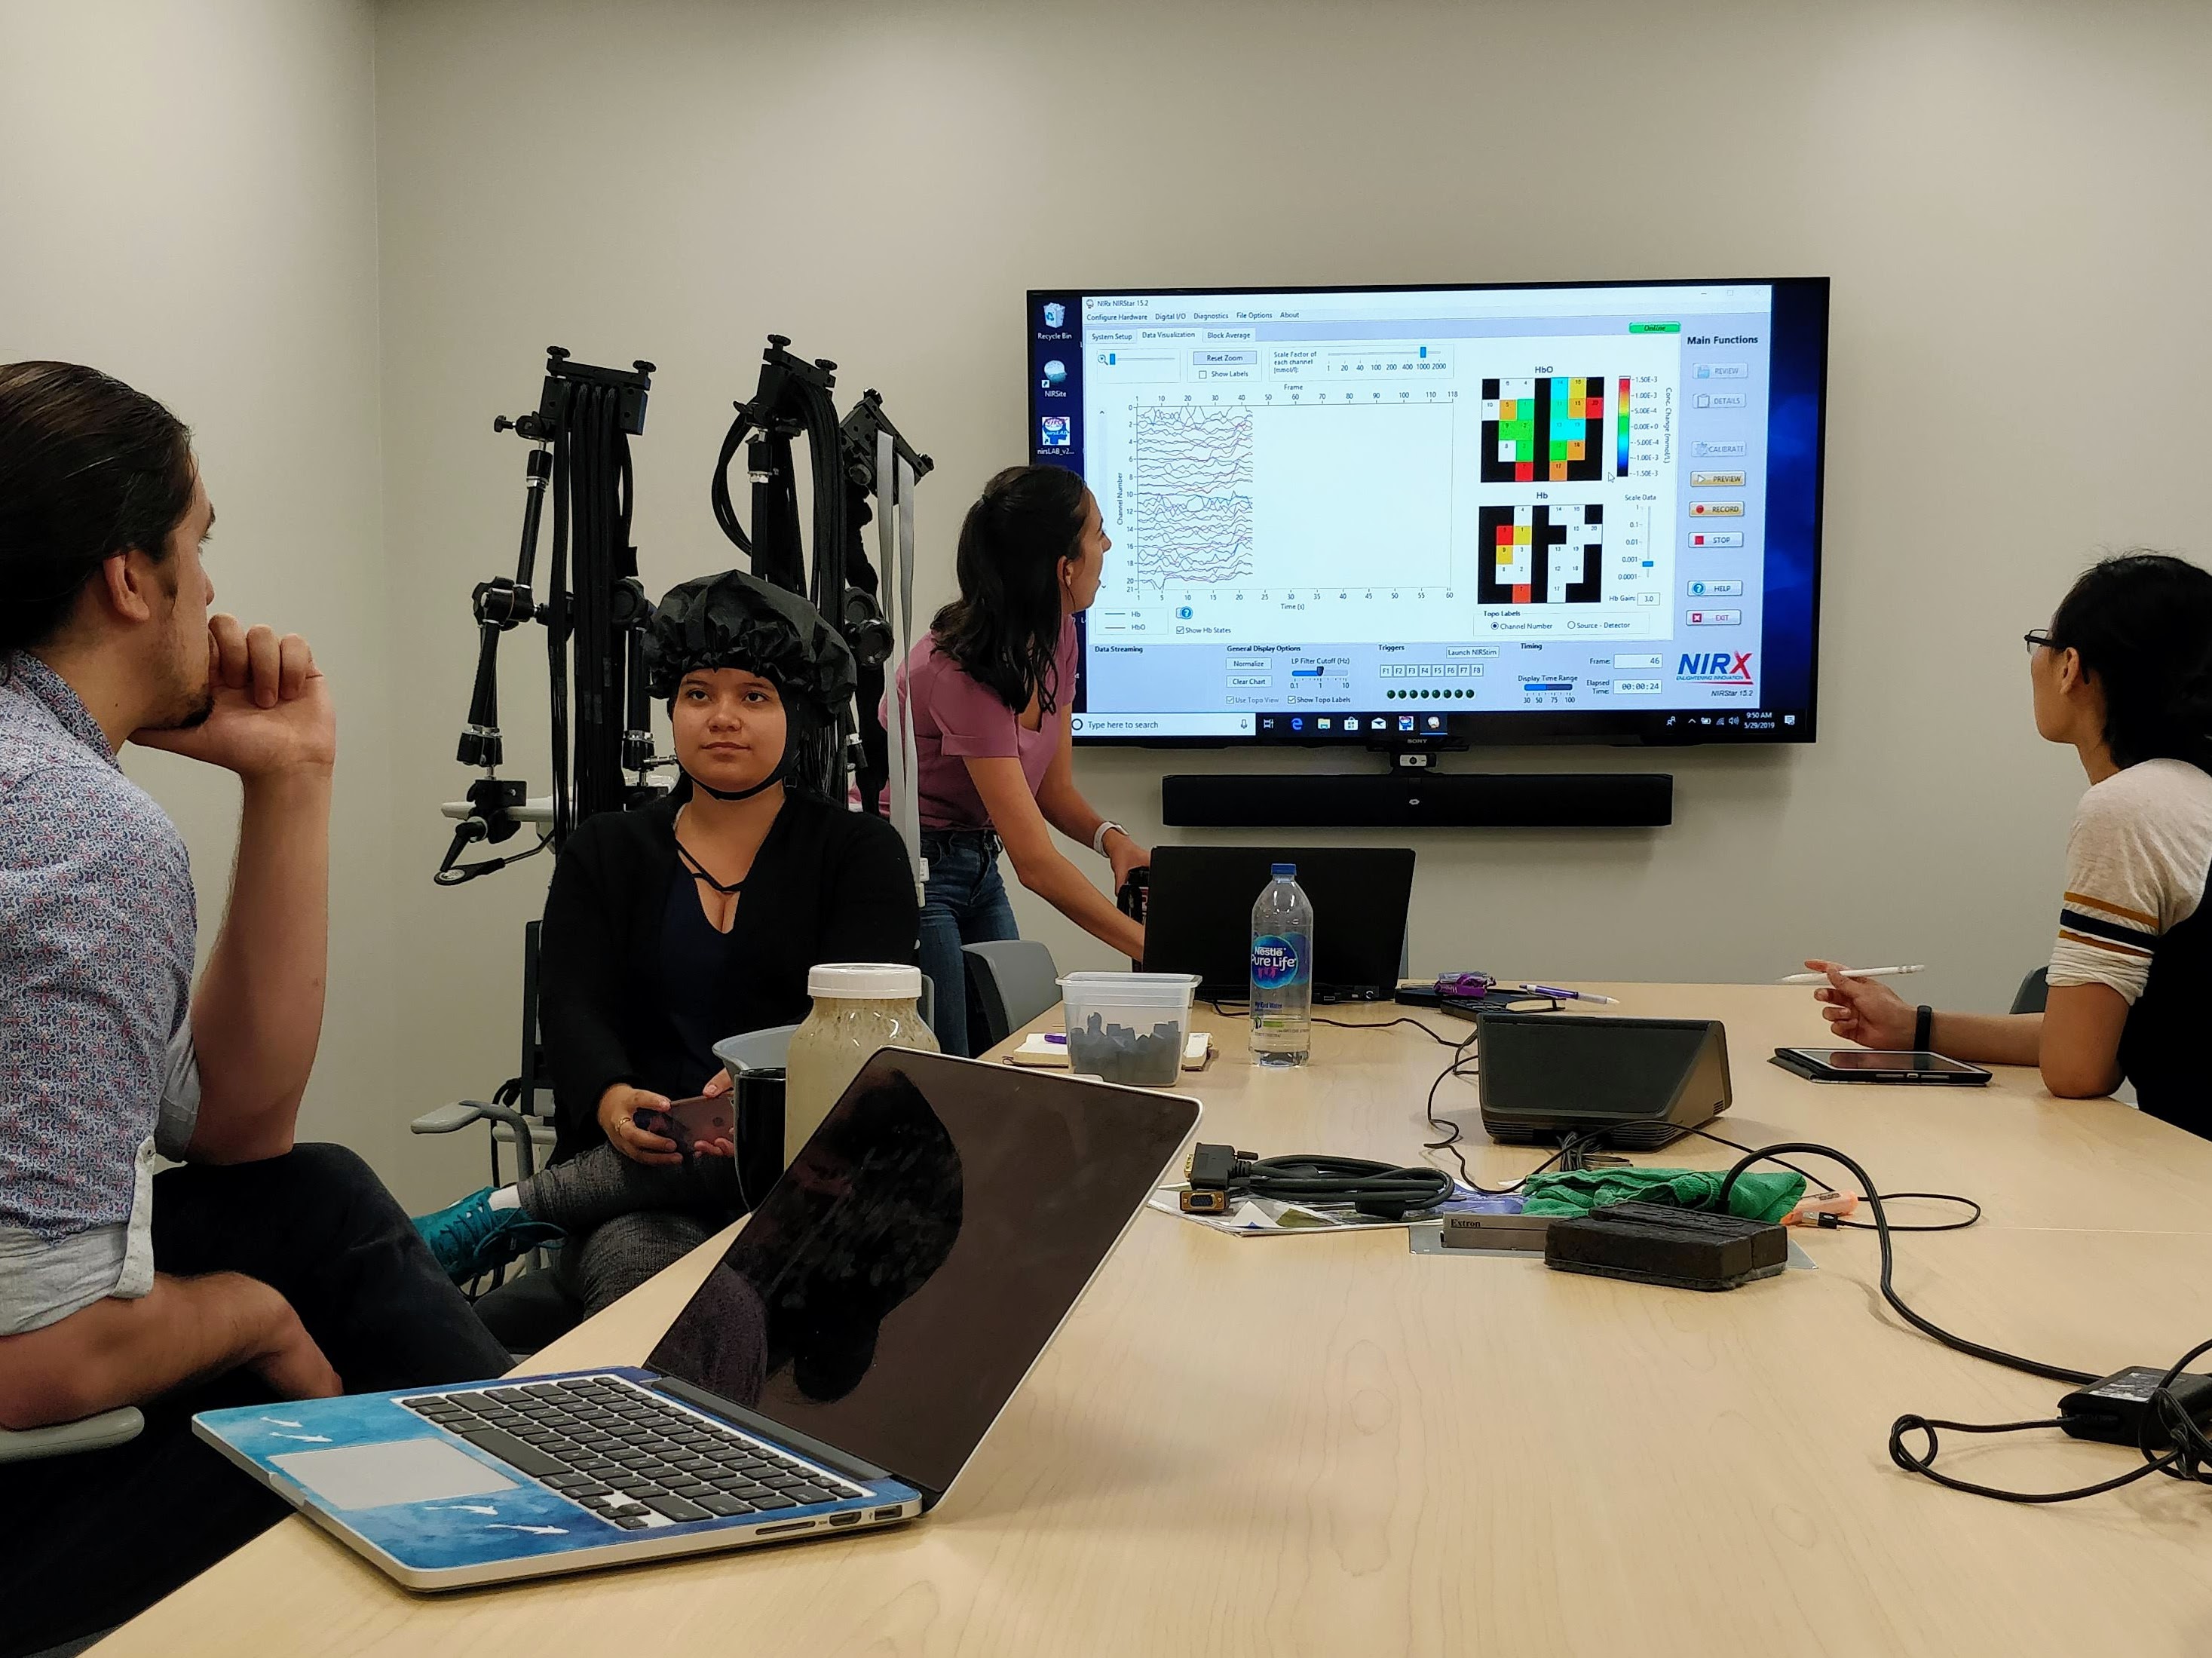
A lab meeting with my student learning fNIRS

Notice that all of these assume you that put in some time and effort to understanding the theory and then allow some time to work over ideas in your mind, on paper, or in a computer simulation.

  • Work on hypothesis generation in lab meetings, our advisory meetings, and on your own.
  • Document your thoughts in Google Docs (or your own notes on paper, OneNote or Evernote).
  • Share insights in lab meetings and in the relevant channel in Slack.

Design the Study/Experiment

Concurrent with hypothesis generation is experimental design. In most case, we are designing experiments to test hypotheses about category representation and category learning and/or the predictions of computational models. We want to test hypothesis generated from theories and also carry out exploratory work to help refine our theories. Avoid the temptation to put the cart before the horse and come up with experiments and studies that will produce an effect for its own sake. We don’t just want to generate effects.

The design comes first. Consider the logic of your experiment, what you plan to manipulate, and what you want to measure. Avoid the temptation to add in more measures than you need, just to see if there’s an effect. For example, do you need to add in 2-3 measures of working memory, mood, or some demographic information just to see if there’s an effect there? If it’s not fully justified, it may hurt more than help because you have non-theoretically driven measures to contend with. I’ve been guilty of this in the past and it always comes back to haunt me.

  • Work on experiment generation in lab meetings, advisory meetings, on your own.
  • Document your work and ideas in Google Docs or a note taking app that you can share.
  • Use G*Power to estimate correct sample size.
  • Use PsychoPy or Qualtrics to build your experiment.
  • Test these experiment protocols often, on your self, on lab mates, on volunteers
  • Develop a script for research assistants who will be helping you carry out the study.
  • Share insights in lab meetings and in the relevant channel in Slack.
  • Organize tasks and chores in the relevant Trello board for your project.

Analysis Plan & Ethics Protocol

This is where we start to formalize things. An analysis plan will link together the hypothesis and the experimental design with the dependent variables and/outcome measures. In this plan, we’ll describe and document how the data will be collected, visualized, analyzed, stored and shared. This plan should describe how we will deal with outlier data, missing data, data from participants who did not complete the experiment correctly, experimenter error, malfunction, etc. This plan can include tentative predictions derived from a model and also a justification of how we intend to analyze and interpret the data. This plan can also be pre-registered with OSF, which is where we’ll plan to share the data we collect with the scientific community.

At the same time we also want to write an ethics protocol. This is a description of our experiment, the research question, and procedures for the University REB. This will also include standardized forms for information and consent, a policy for recruitment, subject safety, data storage and security. The REB has templates and examples, and our lab Slack channel on ethics can include examples as well. Use templates when ever possible.

Both of these documents, the analysis plan and the ethics protocol, should describe exactly what we are doing and why we are doing it. They should provide enough information that someone else would be able to reproduce our experiments in their own lab. These documents will also provide an outline for your eventual method section and your results section.

  • Document your analysis plan and ethics protocol work in Google Docs.
  • Link these documents to the project sheet or Trello board for your project.
  • Share in the relevant channel in Slack.

Collect Data

Once the experiment is designed, the stimuli have been examined, we’re ready to collect data or to obtain data from a third party (which might be appropriate for model testing). Before you run your first subject, however, there are some things to consider. Take some time to run yourself through every condition several times and ask other lab members to do the same. You can use this to make sure things are working exactly as you intend, to make sure the data are being saved on the computer, and to make sure the experiment takes as long as planned.

When you are ready to collect data for your experiment:

  • Meet with all of your research volunteers to go over the procedure.
  • Book the experiment rooms on the Google Calendar.
  • Reserve a laptop or laptops on the Google Calendar.
  • Recruit participants though SONA or flyers.
  • Prepare the study for M-Turk or Prolific
  • Use our lab email for recruitment.

After you have run through your experiment several time, documented all the steps, and ensured that the everything is working exactly as you intended, you are ready to begin. While you are running your experiment:

  • Document the study in Google Docs, Trello, and/or Slack (as appropriate)
  • Make a note of anything unusual or out of the ordinary for every participant in a behavioural study.
  • Collect signatures from participants if you are paying them.
  • Data should stored in text files that can be opened with Excel or Google sheets or imported directly into R. Be sure these are linked to the project sheet.
  • Make sure the raw data are labelled consistently and are never altered.
  • Be sure to follow the data storage procedures outlined in the ethics protocol.

Data Management

Your data plan should specify where and how to store your data. While you are collecting data you should be working on a script in R (or Python) to extract and summarize the raw data according to your plan. When you reach the planned sample size, ensure that all of that data are secure and backed up and do an initial summary with your R script.

As you work on summarizing and managing your data:

  • Make notes in the project sheet and/or Trello board about where the data are stored
  • Document your steps in an R Notebook (or Python Notebook).

Plots & Stats

Remember the photo of Dr. Katie Bouman, then a postdoc, when she first saw the rendering of the first photos of a black hole that her algorithms generated? That’s the best part of science: seeing your data visualized for the first time. When you have completed your experiment and taken care of the data storage and basic processing, it’s time to have fun and see what you discovered. The analysis plan is your guide and your analysis plan describes how you want to analyze the data, what your dependent variables are, and how to conduct statistical test with you data to test the hypothesis. But before you do any statistics, work on visualizing the data. Use your R notebook to document everything and generate boxplots, scatter plots, or violin plots to see the means, medians, and the distribution for the data.

Because you are using R Notebooks to do the analysis, you can write detailed descriptions of how you created the plot, what the plot is showing, and how we should interpret the plot. If you need to drop or eliminate a subject’s data for any reason, exclude them in from data set in R, do not delete the data from the raw data file. Make a comment in the script of which subject was dropped and why. This will be clear and transparent.

You can also use R to conduct the tests that we proposed to use in the analysis plan. This might be straightforward ANOVA or t-test, LME models, regression, etc. Follow the plan you wrote, and if you deviate from the plan, justify and document that exploratory analysis.

If you are fitting a decision boundary model to your data, make sure you have the code for the model (these will be on my GitHub) and you should do your modelling separately from the behavioural analysis. The GLM models are saved as R scripts but you should copy or fork to your R-Notebooks for your analysis so you can document what you did. Make sure that you develop the version for your experiment and that the generic model is not modified.

If you are fitting a prototype or exemplar model, these have been coded in Python. Use Python 3 and a basic text editor or JupyterLab. JupyterLab might be better as it’s able to generate markdown and reproducible code like R Notebooks. Or just call python from R Studio.

  • Follow your analysis plan.
  • Consult with me or your peers if you notice any unusual patterns with anything.
  • Make notes in the project sheet and/or Trello board about what analyses you’ve completed.
  • Document your steps in an R Notebook (or Python Notebook).
  • If you drop a participant for any reason, indicate in the comments of your R script (or other notes). We want this information to recorded and transparent.

Present and Explain Your Work

While you working on your analysis, you should present the interim work often in lab meetings for the rest of the group and we can discuss the work when we meet individually. The reason to present and discuss often is to keep the ideas and work fresh in your mind by reviewing manageable pieces of it. If you try to do too much at once, you may miss something or forget to document a step. Go over your work, make sure its documented, and then work on the new analyses, and repeat. You should be familiar with your data and your analysis so that you can explain it to yourself, to me, to your peers, end eventually anyone who reads your paper.

Use the following guidelines for developing your work:

  • Make your best plots and figures.
  • Present these to the lab on a regular basis.
  • Use RPubs to share summary work instantly with each other and on the web
  • Keep improving the analysis after each iteration.
  • You should always have 8-10 slides that you can present to the group.
  • Document your work in R Notebooks, Google Docs, Trello, and Google Slides.

Write Papers Around This Workflow

The final step is to write a paper that describes your research question, your experimental design, your analysis, and your interpretation of what the analysis means. A scientific paper, in my opinion has two important features:

  1. The paper should be clear and complete. That means it describes exactly what you wanted to find out, how and why you designed your experiment, how you collected your data, how you analyzed your data, what you discovered, and what that means. Clear and complete also means that it can be used by you or by others to reproduce your experiments.
  2. The paper should be interesting. A scientific paper should be interesting to read. It needs to connect to a testable theory, some problem in the literature, an unexplained observation. It is just as long as it needs to be.

I think the best way to generate a good paper is to make good figures. Try to tell the story of your theory, experiment, and results with figures. The paper is really just writing how you made the figures. You might have a theory or model that you can use a figure to explain. You can create clear figures for the experimental design, the task, and the stimuli. Your data figures, that you made according to you analysis plan, will frame the results section and a lot of what you write is telling the reader what they show, how you made them, and what they mean figures. Writing a scientific paper is writing a narrative for your figures.

Good writing requires good thinking and good planning. But if you’ve been working on your experiment according to this plan, you’ve already done a lot of the thinking and planning work that you need to do to write things out. You’ve already made notes about the literature and prior work for your introduction. You have notes from your experimental design phase to frame the experiment. You have an ethics protocol for your methods section and an analysis plan for your results. You’ll need to write the discussion section after you understand the results, but if you’ve been presenting your 8-10 slides in lab meeting and talking about them you will have some good ideas and the writing should flow. Finally, if you’ve been keeping track of the papers in Paperpile, your reference section should be easy.

Submit the paper

The final paper may have several experiments, each around the theme set out in the introduction. It’s a record of what we did, why we did it, and how. The peer reviewed journal article is the final stage, but before we submit the paper we have a few other steps to ensure that our work roughly conforms to the principles of Open Science, each of which should be straightforward if we’ve followed this plan.

  • Create a publication quality preprint using the lab template. We’ll host this on PsyArXiv (unless submitting a blind ms.)
  • Create a file for all the stimuli or materials that we used and upload to OSF.
  • Create a data archive with all the raw, de-identified data and upload to OSF.
  • Upload a clean version of your R Notebook that describe your analyses and upload to OSF.

The final steps are organized around the requirements of each journal. Depending on where we decide to submit our paper, some of these may change. Some journals will insist on a word doc file, others will allow for PDF. In both cases, assume that the Google Doc is the real version, and the PDF or the .doc files are just for the journal submission. Common steps include:

  • Download the Google Doc as a MS Word Doc or PDF.
  • Create a blind manuscript if required.
  • Embed the figures if possible otherwise place at the end.
  • Write a cover letter that summarizes paper and why we are submitting.
  • Identify possible reviewers.
  • Write additional summaries as required and generate keywords.
  • Check and verify the names, affiliations, and contact information for all authors.
  • Submit and wait for 8-12 weeks!

Conclusion

As I mentioned at the outset, this might not work for every lab or every project. But the take home message–document everything you do and share your work for feedback–should resonate with most science and scholarship. Is it necessary to have a formal guide? Maybe not, though I found it instructive for me as the PI to write this all down. Many of these practices were already in place, but not really formalized. Do you have a similar document or plan for your lab? I’d be happy to hear in the comments below.

Use Paperpile’s Annotation System

Reading scientific papers as PDFs is a major part of being an academic. Professors, postdocs, grad students and undergraduates end up working with PDFs, making notes, and then using those notes to write a manuscript or paper. Although there are lots of great PDF viewers and reference managers, I use Paperpile, which is cloud-based PDF manager and was originally designed to be a reference manager for Google Docs. It can sync all your PDFs with your Google Drive (so you can read them offline) and neatly integrates with Google Scholar and Chrome so that you can import references and PDFs from anywhere. It handles citations in Docs and in Word and has a beta app for iPad that is brilliant.

We use this in my lab all the time. It’s a paid app, but it is not very expensive, they have education pricing and as the lab PI, I just pay for a site license for all my trainees.

Making Notes

One of the best features is the notes-taking and annotation system. Like most PDF viewers, the built in PDF viewers lets you highlight, markup, and annotate PDFs with sticky notes. These annotations stay with the PDF and will sync across devices because it’s cloud based. Just like in Adobe or Apple Preview, you can highlight, add notes, use strike-thru, or even draw with a pencil. Paperpile organizes these well and makes it easy to navigate. And if you use the iPad app you can make notes there that will show up in the browser and notes in the browser will show up on the iPad. The icon on the upper right hides your notes.

Screen Shot 2020-01-18 at 6.49.03 AM

Exporting and Sharing

If you’re reading along, taking notes and making highlights, you may want to share these with someone or use them in a manuscript (or even a manuscript review). There are several ways to do this.

Export the PDF

The File menu lets you print with or without annotations. If you want to send the PDF to someone as a clean PDF without your notes, that’s easy to do. Or it will save your notes in the new PDF.

Screen Shot 2020-01-18 at 6.49.58 AM

The exported PDF opens in other PDF viewers with your notes intact and editable (Apple Preview is shown below). This is great to share with someone who does not use Paperpile. Of course, you can print a clean PDF without the annotations.

Screen Shot 2020-01-18 at 6.51.12 AM

Export the annotations only

If you planning to write an an annotated bibliography, a critical review, a meta analysis, a paper for class or even a manuscript review for a journal, the ability is export the notes is invaluable. Using the same File menu, you will see the “export” option. This lets you export just your notes and highlights in several formats. If you want it to share on line, for examples, try the HTML option. This is great if you are writing a blog and wanted to include screen shots and notes. Notice that this keeps the annotations (notes, images, highlights) on the right and data about who made the notes on the left. Helpful if more than one person are making notes.

Screen Shot 2020-01-18 at 7.10.12 AM 
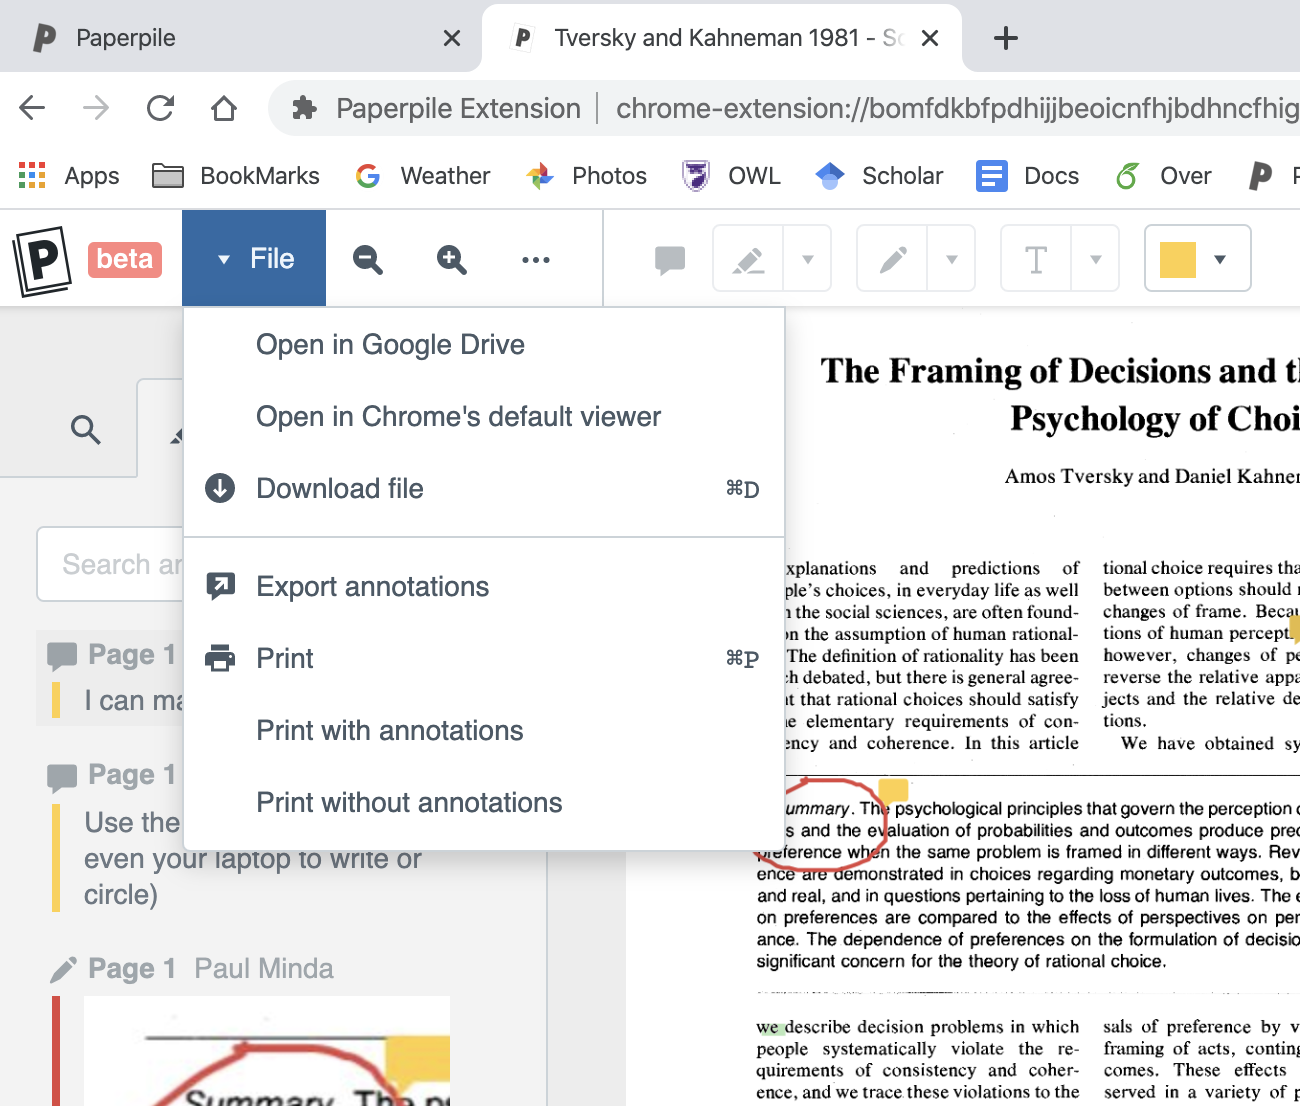
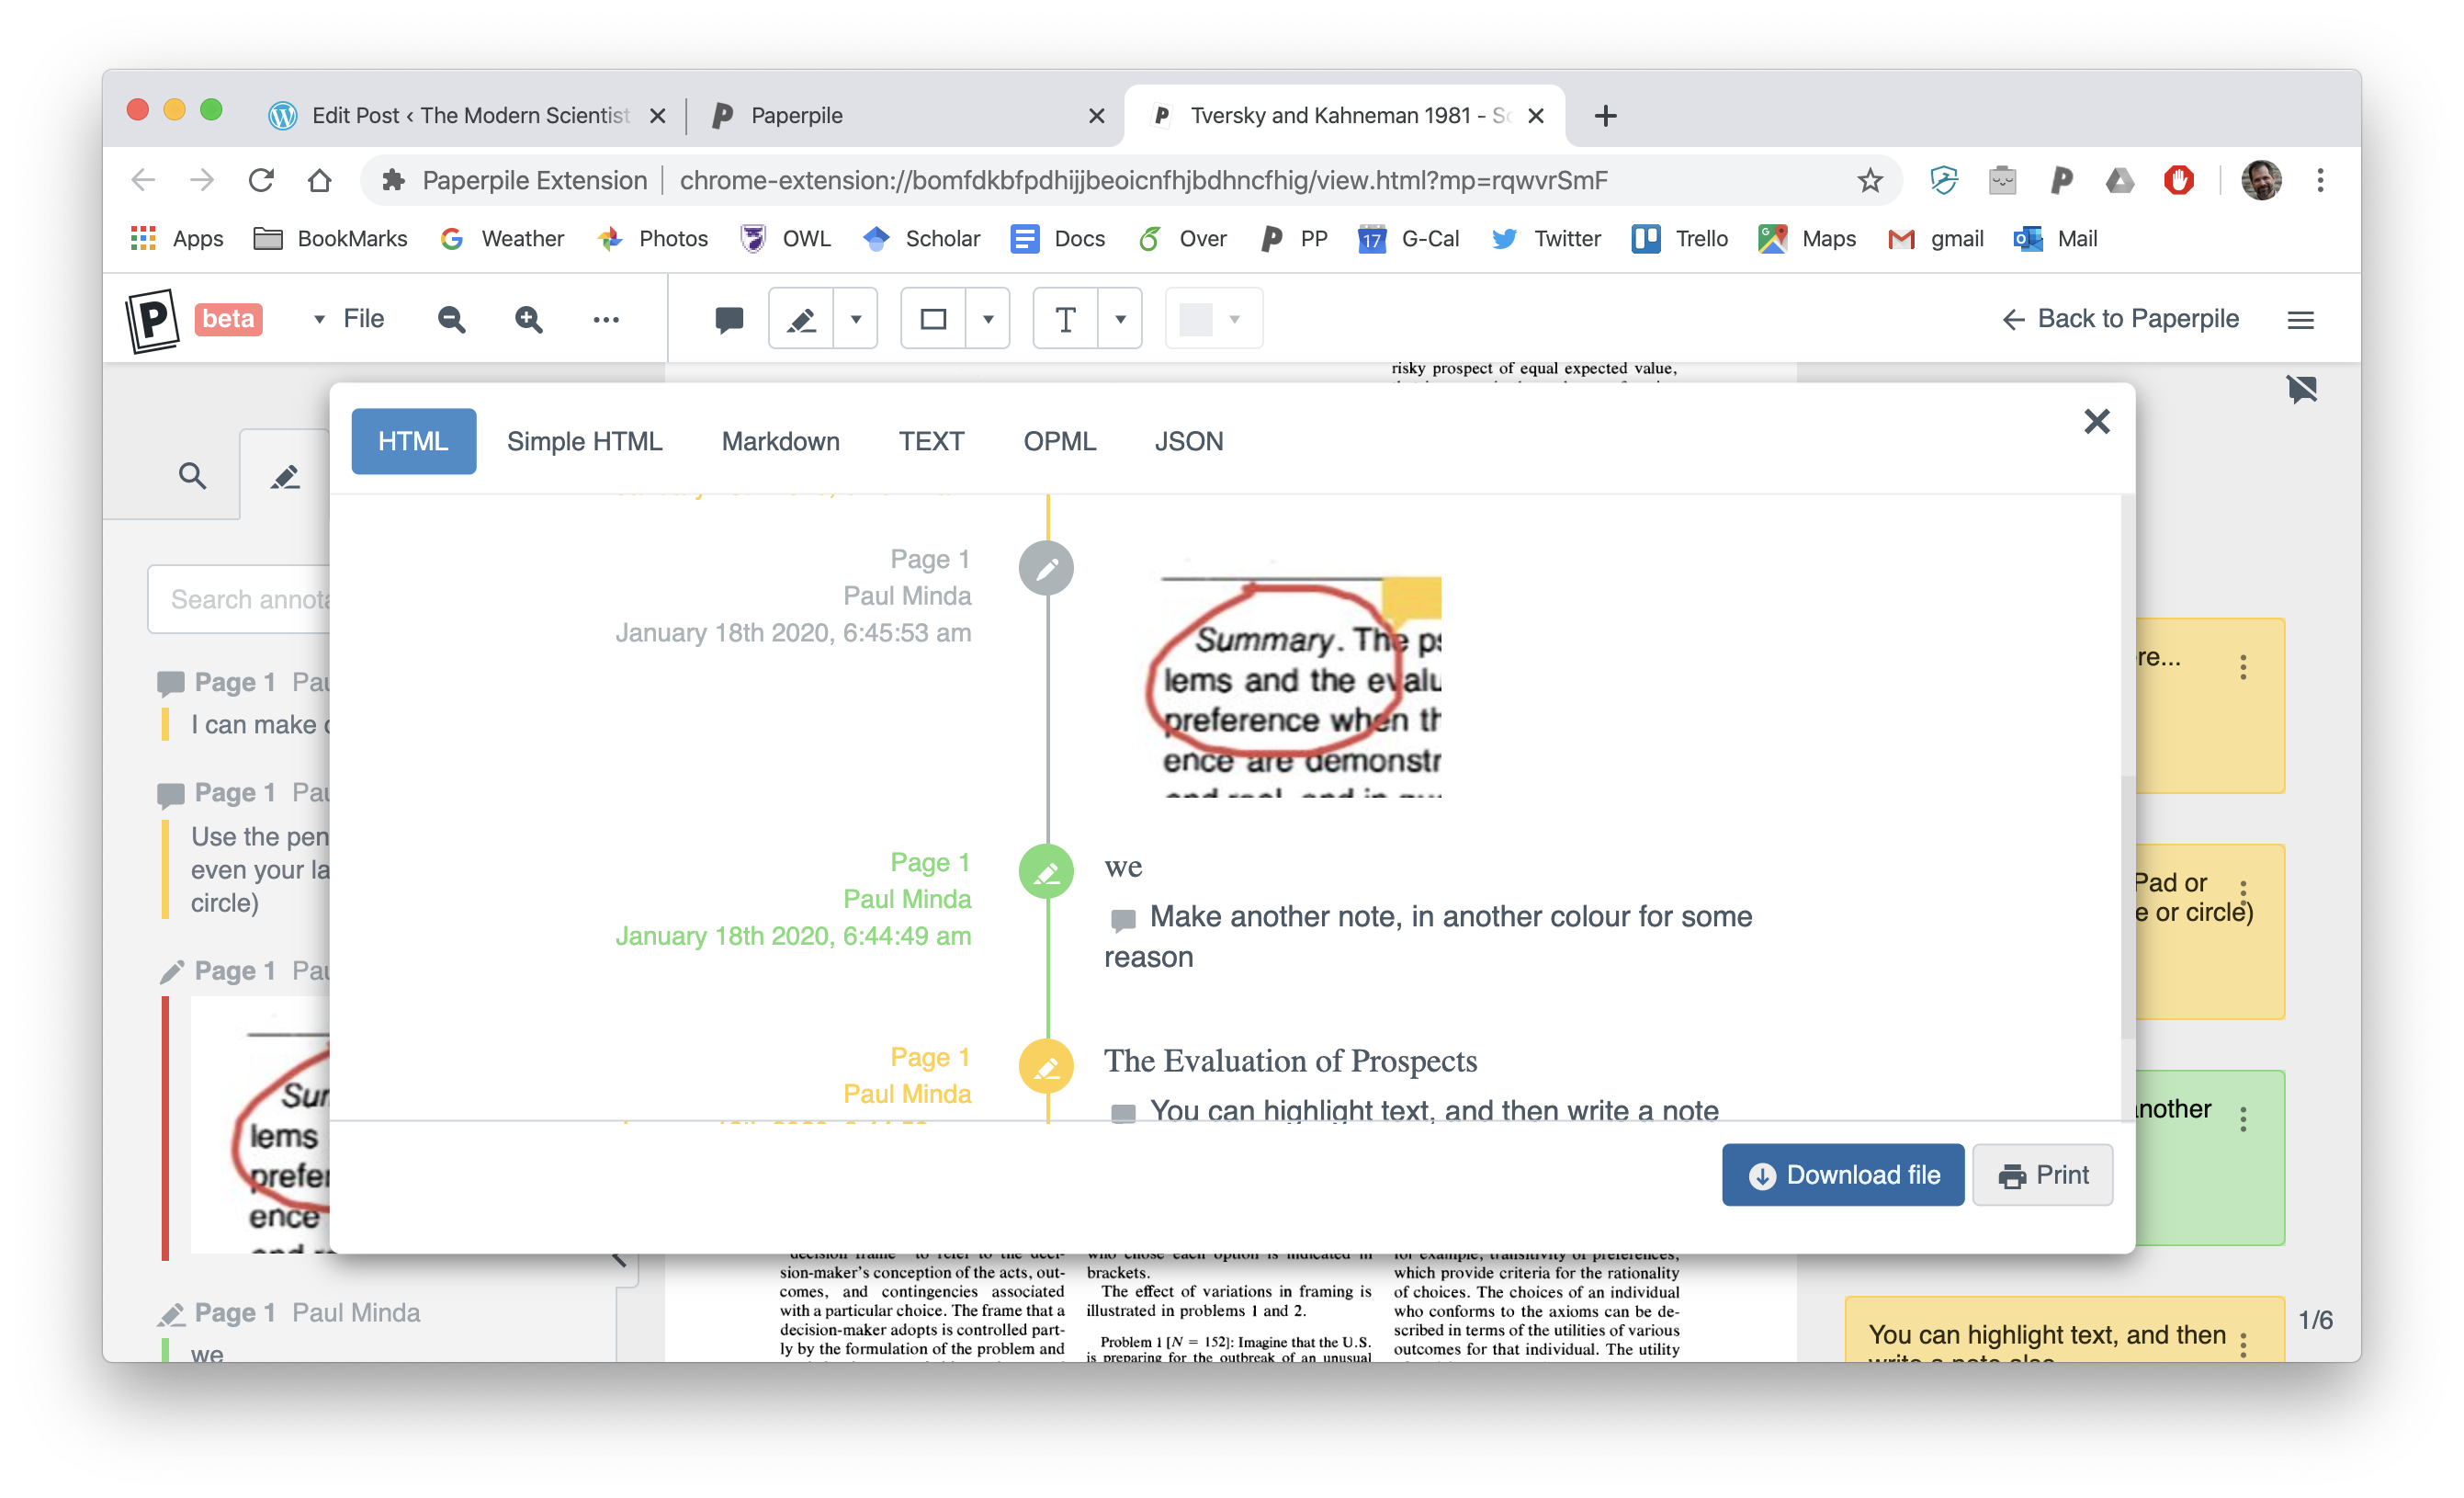
And of course, if you’re using this annotation tool to make notes for your own paper or a manuscript review, you can export just your notes as text or markdown and open in Google Docs, Word, or any editor and use those to help frame your draft. You have the contents of the notes as text and can quote highlighted text. Images are not saved, of course.

Conclusion

In my opinion, Paperpile is the best reference manager and PDF manager on the scene. Others, like Zotero, Mendeley, and Endnote are also good (and Zotero is free, of course). Each has things they do really well, but if you already use Paperpile, or are curious about it, I strongly suggest you spend some time with the PDF viewer and annotations. It’s really changed my workflow for the better. It’s just such well designed software.


Comments, corrections, and suggestion are always welcome.

The Professor, the PI, and the Manager

Here’s a question that I often ask myself: How much should I be managing my lab?

I was meeting with one of my trainees the other day and this grad student mentioned that they sometimes feel like they don’t know what to do during the work day and that they sometimes feel like they are wasting a lot of their time. As a result, this student will end up going home and maybe working on a coding class, or (more often) doing non grad school things. We talked about what this student is doing and I agreed: they are wasting a lot of time, and not really working very effectively.

Before I go on, some background…

There is no shortage of direction in my lab, or at least I don’t think so. I think I have a lot of things in place. Here’s a sample:

  • I have a detailed lab manual that all my trainees have access to. I’ve sent this document to my lab members a few times, and it covers a whole range of topics about how I’d like my lab group to work.
  • We meet as a lab 2 times a week. One day is to present literature (journal club) and the other day is to discuss the current research in the lab. There are readings to prepare, discussions to lead, and I expect everyone to contribute.
  • I meet with each trainee, one-on-one, at least every other week, and we go though what each student is working on.
  • We have an active lab Slack team, every project has a channel.
  • We have a project management Google sheet with deadlines and tasks that everyone can edit, add things to, see what’s been done and what hasn’t been done.

So there is always stuff to do but I also try not to be a micromanager of my trainees. I generally assume that students will want to be learning and developing their scientific skill set. This student is someone who has been pretty set of looking for work outside of academics, and I’m a big champion of that. I am a champion of helping any of my trainees find a good path. But despite all the project management and meetings this student was feeling lost and never sure what to work on. And so they were feeling like grad school has nothing to offer in the realm of skill development for this career direction. Are my other trainees also feeling the same way?

Too much or too little?

I was kind of surprised to hear one of my students say that they don’t know what to work on, because I have been working harder than ever to make sure my lab is well structured. We’ve even dedicated several lab meetings to the topic.

The student asked what I work on during the day, and it occurred to me that I don’t always discuss my daily routine. So we met for over an hour and I showed this student what I’d been working on for the past week: an R-notebook that will accompany a manuscript I’m writing that will allow for all the analysis of an experiment to be open and transparent. We talked about how much time that’s been taking, how I spent 1-2 days optimizing the R code for a computational model. How this code will then need clear documentation. How the OSF page will also need folders for the data files, stimuli, the experimenter instructions. And how those need to be uploaded. I have been spending dozens of hours on this one small part of one component of one project within one of the several research areas in my lab, and there’s so much more to do.

Why aren’t my trainees doing the same? Why aren’t they seeing this, despite all the project management I’ve been doing?

I want to be clear, I am not trying to be critical in any way of any of my trainees. I’m not singling anyone out. They are good students, and it’s literally my job to guide and advise them. So I’m left with the feeling that they are feeling unguided, with the perception that that there’s not much to do. If I’m supposed to be the guide and they are feeling unguided, this seems like a problem with my guidance.

What can I do to help motivate?

What can I do to help them organize, feel motivated, and productive?

I expect some independence for PhD students, but am I giving them too much? I wonder if my lab would be a better training experience if I were just a bit more of a manager.

  • Should I require students to be in the lab every day?
  • Should I expect daily summaries?
  • Should I require more daily evidence that they are making progress?
  • Am I sabotaging my efforts to cultivate independence by letting them be independent?
  • Would my students be better off if I assumed more of a top down, managerial role?

I don’t know the answers to these questions. But I know that there’s a problem. I don’t want to be a boss, expecting them to punch the clock, but I also don’t want them to float without purpose.

I’d appreciate input from other PIs. How much independence is too much? Do you find that your grad students are struggling to know what to do?

If you have something to say about this, let me know in the comments.

The Infinity: Email Management and Engagement

It’s a cold and rainy Sunday morning in November. I’m drinking some delicious dark coffee from Balzac’s.

My wife and I are each working on different things and taking advantage of the relative morning quiet. I’m at the kitchen table working off my laptop, listening to music on my headphones, and working on overview material: looking at the emails I have to respond to. I criticize myself for procrastinating, which is in itself an extra layer of procrastinating.

Email is the engine of misery

I take a look at my work email inbox. It is not too bad for a professor. I keep it organized and the inbox contains one those things that need a reply. But there at 59 messages in there that I need to reply to;  four of these have been awaiting a reply since September. Even while I write this, I’m feeling a real sense of anxiety and conflict. On the one hand, I greatly desire to spend hours slogging though the entire list and trying to deal with backlog. I’d love to look at INBOX = 0. I think that would make me feel great (which is a strange belief to have…I have never had INBOX = 0, so how do I know it would make me feel great?) Even an hour could make a good dent and dispense with at least 2/3 of the messages.

But at the same time, I want to ignore all of it. To delete all the email. I think about Donald Knuth’s quote about email. Knuth is a computer scientist at Stanford, who developed, among other things, the “TeX” system of typesetting. He has an entry on his website about email and indicted that he does not have an address.

“Email is a wonderful thing for people whose role in life is to be on top of things. But not for me; my role is to be on the bottom of things. What I do takes long hours of studying and uninterruptible concentration. I try to learn certain areas of computer science exhaustively; then I try to digest that knowledge into a form that is accessible to people who don’t have time for such study.”

This quote, and the idea here, has been one of the things that I really aspire to. It’s one of my favourite quotes and a guiding principle…but I can’t make the leap. Like Knuth, I also write books, articles, and I try to get to the bottom of things. But it seems like I never scratch the surface because I’m always responding to email, sending email, Tweeting and engaging on social media. Deeper analysis never happens because I’m preoccupied with this surface. I feel trapped by this.

And yet, I cannot ignore the surface level. Engagement with email is part of my job. Others depend my responding. For example, I have a now retried departmental colleague who just never responded to email, and this was very frustrating to deal with. I suspect (I know) that others picked up the slack when he failed to be responsive. I have a current colleague who is much the same. So I don’t endorse blowing off some aspects of one’s job, knowing that others will pick these pieces up. I don’t want to shirk my administrative and teaching responsibilities, even if it means I sacrifice the ability to have dedicated research and writing time.

Give and Take

In the end, I am trapped in a cage that I spend hours each day making stronger. Trapped in a pit that I work ever longer hours to make deeper. The incoming email will not stop, but one could probably slow it down by not sending any email out, by providing FAQs on my syllabus about when to email, by delegating email to TAs.

The real question is, if I give less time to email, will it take less of my time away? If so, will I use that time wisely? Or will I turn to another form of distraction. Is email the problem? Or am I the problem?

The one “productivity hack” that you probably avoid like the plague

A few weeks ago, my office phone rang. It rarely does, and even when it does ring, I rarely answer it. I usually let the call go to voicemail. My outgoing voicemail actually says: “I never check voicemail, please email me at…“. And even if someone does leave a voicemail, it’s transcribed by the university email systems and sent to my email.

This is so inefficient, and self-sabotaging, given that I, like most academics, moan about how much email I have to process.

But this time, noticing that it was another professor in my department who was calling, I picked it up. My colleague who was calling is the co-ordinator for the Psychology Honours program and he had a simple question about the project that one of my undergraduate Honours students was working on. We solved the issue in about 45 seconds.

If I had followed my standard protocol, he would have left a voicemail or emailed me (or both). It would have probably taken me a day to respond, and the email would have taken 5-8 minutes for me to write. He’d have then replied (a day later), and if my email was not clear, there might have been another email. Picking up the phone saved each of us time and effort and allowed my student’s proposed project to proceed.

Phone Aversion

Why are we so averse to using the phone?

I understand why in principal: it’s intrusive, it takes you out of what you were doing (answering email, probably), and you have to switch tasks.  The act of having to disengage from what you are doing and manage a call is a cognitively-demanding action.  After the call, you then have to switch back. So it’s natural to make a prospective judgement to avoid taking the call.

And from the perspective of the caller, you might call and not get an answer, then you have to engage a new decision-making process: Should I leave a message, call again, or just email. This cognitive switching takes time and effort. And of course, as many of us resent being interrupted by a call, we may also assume that the person we are calling also resents the interruption and so we avoid calling out of politeness (maybe this more of a Canadian thing…)

So there are legitimate, cognitive and social/cognitive reasons to avoid using the phone.

We Should Make and Take More Calls

My experience was a small revelation, though. Mostly because after the call, while I was switching back to what I had been doing prior, I thought about how much longer (days) the standard email approach would have taken. So I decided that, going forward, that I’m going to try to make and take more calls. It can be a personal experiment.

I tried this approach a few days ago with some non-university contacts (for the youth sports league I help to manage). We saved time and effort. Yes, it might have taken a few minutes out of each other’s day, but it paled in comparison to what an email-based approach would have taken.

For Further Study

Although I’m running a “personal experiment” on phone call efficiency, I’d kind of like to study this in more detail. Perhaps design a series of experiments in which two (or more) people are given a complex problem to solve and we can manipulate how much time they can spend on email vs time on the phone. We’d track things like cognitive interference. I’m not exactly sure how to do this, but I’d like to look at it more systematically. The key things would be how effectively people solve the problems, and if and how one mode of communication interferes with other tasks.

Final Thoughts

Do you prefer email or a phone call? Have you ever solved a problem faster on the phone vs email? Have you ever found the reverse to be true?

Or do you prefer messaging (Slack, Google Chat, etc.) which is more dynamic than email but not as intrusive as a phone call?