Author Archives: John Paul Minda

About John Paul Minda

Professor of Psychology at Western University. I mostly write about cognitive psychology, science, & higher ed. Sometimes running, food, & cats.

Stopping by to code on a snowy evening

Like most people, I’ve grown up with computers. I’m 52 and I’ve been messing around with computers since I was 12, in 1982.

Coding is cozy

I’ve always associated learning how to code with the cold, grey winter days near the solstice. There’s something about wanting to be inside when it’s blustery out, concentrating on a task. I think it’s the same reason people like to do jigsaw puzzles, crossword puzzles, build models, do knitting, crafting, bake cookies, or quiet board games. And maybe it’s not an accident that a lot of people take part in the Advent of Code this time of year. Coding is cozy.

Apollo, PA

My mom was a math teacher at a small Catholic elementary school in a town with a weird, retro-future connection: Apollo, Pennsylvania. Apollo was laid out in 1790 and renamed Apollo in 1848. It is one of the few—maybe the only— city/state palindromes. And although a tiny village the town, also had a moon landing festival that’s been running almost uninterrupted since 1969 to celebrate the original Apollo moon landing. To be clear, the town has nothing in connection with the NASA mission, other than the name “Apollo”. Apollo also had a nuclear facility subcontracted by Westinghouse to produce nuclear fuel. The plant had a terrible safety record and was at the center of a missing uranium-235 scandal, which gave the town a slightly creepy, cold-war vibe.

Our first computer

The school got a small grant to purchase a single TRS-80 model 1 in 1982 when I was in 7th grade. They later purchased a TRS 80 model III. None of the teachers knew anything about how to use this. And they were not interested. So my mom brought it home for a few weeks over the Christmas break in 1982, and we kept it for a little while while she learned how to use it. Of course, I want to learn how to use it too.

There was no hard drive. There wasn’t even a “floppy” drive. There was no connection to the internet (but of course you wanted the acoustic phone modem), and no preinstalled, software or apps. Data was stored on a cassette tape. If you wanted to run something, you often found the code printed out in a magazine or a book. The Model I guide book came with the code to produce several simple games and programs. And that’s how I learn to code. During winter break typing out TRS-BASIC Level 1.

It’s a photograph of me, probably in 1983, delicately handling floppy desk for a TRS 80 III computer

I don’t think I have a picture of me with the old Model I, but here I am with the model III a year later (it stored programs on a floppy disk, which I’m holding). I know this is during the winter time also because I’m still in my Pittsburgh Steelers pyjamas that I got for Christmas.

Coding is poetry

One of my favourite programs of all time was “Stopping by the Woods”, which was printed in the original TRS-80 I manual. It reproduced the poem by Robert Frost line-by-line on the screen. At the same time, it used a simple randomization subroutine to place pixel blocks on the screen that looked like snow. It was monochrome. A black and white monitor with only white pixels. So it worked really well. I remember doing this during the winter time and being struck by how this by the way, they brought together poetry, chance, and coding. I think that had a big influence on me.

Here’s what it look like, on a YouTube video.

Each line of the poem is listed separately, and after each line, a command sends things to a subroutine (GOTOSUB6000) to generate random snow, which then sends it back to where it came from (RETURN). Open the screenshot below to see.

If you have a few quiet days over the next few weeks, I hope you have a chance to do some coding, create and solve some new puzzles, read some winter poetry, or just find the time to reflect on the things that give you peace.

Slow Social

When Elon Musk finalized his purchase of Twitter, I began to think about whether it would be worth staying on Twitter. I’m not alone, and there are many users wondering the same thing. Not all of it is Musk related, but often that’s a catalyst.

And even in the best case scenario, where truly harmful stuff stays off the site, Musk’s stated plan for Twitter is to make it the “the most respected advertising platform in the world” which sound really boring, to be honest. And not something I’m especially interested in.

Do I need to be here?

I’ve been thinking about how I use social media these days. Not how social media is supposed to be used, not how others use it, not how Musk and Zuck want me to use it, but how I actually use it.

Generally speaking, I use social media as a platform to get tiny bursts of approval. I like some self expression and I also like getting some positive feedback on things that I write or share. That’s just about it. It sounds hollow and self-centred. It is self-centred.

So is that how I want to use it? Or is that how Musk and Zuck want me to use it? Do they want me here just engaged enough to stay to get some small pleasure from a like or a retweet? I think they do. And why should I give in to that?

Do I need to be here? Do I even need to be anywhere?

How it got that way

I used to use social media more actively. I used Facebook and Twitter to engage, argue, and browse. I used Facebook in the mid 2010 to connect with old friends abut but also argue and comment on news articles—a “digital town square”— but I still checked to see if people liked my comments. It is gratifying to see that others agree with you. But it was also often horrifying to see family and friends doing the same thing with sometimes grotesque opinions, racism, and misogyny. Facebook ended up deepening rifts for many of us, because we now saw what people said behind our backs in full view and we did not always like it. I deleted my FB account in 2018 and only brought it back in 2022, but now it’s just keeping in touch with my family. No opinions. Bland but kind of nice. I’ll post photos of a graduation or my garden.

I moved to Twitter in 2012 because it was becoming the place to share science, ideas, and insights into academia. I did learn a lot about important things like open science and anti racism. At first I really engaged with replies and quote tweets, spirited debate with interesting people. But my usage has stalled. Twitter’s algorithms are dominated by core topics and driven mostly by outrage. Even though I eventually blocked or muted some of the accounts and words, it’s still heavily dominated by narcissistic mega personalities (including Trump & Kanye, who are no longer even on the platform).

Over the past years, I’ve engaged less and less even as my actual tweeting remained the same. I rarely argue or debate. I tweet about covid anxiety, workloads, lockdowns, and some local politics, but mostly it’s little things that make me happy.

Most of my usage now is sending out dispatches of things I like, find, enjoy, get irritated by, am worried about, or think are funny. Thoughts into the void, but still craving that small boost from a like. It’s one sided. I share and get a like. That’s neither good nor bad, but it’s hardly reason to be on twitter vs anywhere else.

I think this is as good a time as any to rethink and perhaps write more longer form and share on this WordPress site. I enjoy self expression. I might still use Facebook or Twitter to share the blog, but I don’t need to be on those sites much beyond that. It’s certainly a slower social media.

I think “slow social” is what I need anyway.

The Unbearable Sameness of Online Meetings

Have you been working from home since March? Are you enjoying it or are you missing your old workplace? Are you are also starting to notice a monotony that seems to lead to mild memory confusion? I am. In this post, I want to explore how and why doing everything online might make it harder to keep things straight.

In 2020, many of us learned to work from home. The novel coronavirus that caused COVID-19 also caused a shift in how a lot of us worked. Across the world, many teachers, tech workers, knowledge workers, people in media, and people in business began working from home and began holding meetings on video meeting platforms like Zoom, Skype, or MS Teams. For many of us, it represented a significant shift in how we did our work, even though much of the content work stayed the same.

At first this was as novel as anything else. I liked writing from home, and I converted the spare bedroom into an office.

My converted spare room home office and near-constant companion, Peppermint the cat.

Great, I thought. We’ll get through this. More than 7 months later I’m not sure. There have been more than enough essays on Zoom fatigue, the challenges of spotty internet, tips for better meetings, and Zoom etiquette. I want to talk about something else. The unbearable sameness of online meetings and its effects on my memory.

Zoom Takes Over

Video meetings have been around for a while in academia, but the near total reliance on them in 2020 was unprecedented. We use our knowledge of the past to help guide our behaviour in new situations. But for this, I had few prior memories available to guide me. What I did have to guide me were my usual routines, like weekly lab meetings and weekly advisory meeting with my students. So that’s how I began to structure my online day. It was similar to my pre-pandemic workday, just using video meetings in place of face-to-face meeting.

I began to teach online using Zoom for student meetings and recording lecture videos. I meet weekly with my graduate students online on Zoom. We hold weekly lab meetings on Zoom. We hold department meetings on Zoom. We have PhD defences and masters thesis defences on Zoom. There are formal Zoom talks and informal zoom coffee breaks. Some people even have Zoom happy hours. Even academic conferences, which have long been a way for academics, researchers, students and scientists to come together from different locations switched to online formats. Soon, I was doing all my work—all my teaching, research, committee work, and mentoring—from the same screen on the same computer in the same room.

Memory Errors

Although a lot of my research and teaching work is able to carried out at home and online, I began to notice some small changes. Not just general fatigue, though that’s also a concern. I was making more simple memory errors (more than usual). For example, I might be talking with one student for 10 minutes about the wrong project. Or I might confuse one meeting for another. A lot of these mistakes were source memory errors. I remembered the student, a topic, and the meeting, but confused which one was which. I was more like the stereotype of the “absent minded professor” than I used to be.

Then I realized a possible source for the problem: Everything looked the same. I was looking at the same screen on the same computer in the same room for everything. This was not typical. For my entire career as an academic, there have always been different places for different activities. I would lecture in a lecture hall or classroom. I would hold seminars in a small discussion room. I would meet with students in my office. I would meet with colleagues at the café on campus. Committee meetings were usually held in meeting rooms and board rooms. I would work on data analyses in my office. I would usually write at home or sometimes in a local café. Different places for different tasks. But now, all the work was in one place. Teaching, research, writing, and advising were all online. And worse, it all looked the same. It was all on the same screen, on Zoom, and in my home office. I no longer had the variety of space, time, location, and context to create a varied set of memory cues.

Location Based Memory

Memory is flexible and our memory depends on spreading activation to activate similar memories. In some cases, local context can be a strong and helpful memory cue. If you encode some information in one context, you will often remember that information better in the same context. Memory retrieval depends on a connection between the cues that were present at encoding and the cues that were present at retrieval. This is how we know how to adjust our behaviour in different contexts.

We react to locations all the time. When you walk into a restaurant or diner, you probably adjust your behaviour. If you are returning to a restaurant that you were at years ago, you will remember having been there before. Students behave differently in class than out of class. Being in specific place helps you remember things that you associated with that place. This is all part of our natural tendency to remember things where and when they are likely to matter most.

But it seemed like this natural tendency was working against me. Each day began and ended at the desk in my home office. Each day I was in the same location when I taught, wrote, met, and carried out analyses. But this was also the same location where I read the news, caught up on Twitter, and ordered groceries online. What I noticed in my new forgetfulness was that I was experiencing memory interference. Everything was starting to look the same. The contextual cues that would normally be a helpful reminder of what I was doing were no longer working as memory cues because they were the same cues for everything and everyone. When everything looks the same, context is no longer a helpful memory cue. If you work, meet, read, write, shop, and casually read the news in exactly the same place, the likelihood that you will make an error of confusion is increased. It’s not that I am forgetting things; It’s just that I am not always remembering the right things

What (if any) solutions?

This is not an easy problem to solve, of course, because as long as COVID is ascendant, I will still have to work from home. But I am trying a few things. One simple fix might be to vary my approach to video meetings. It might help to change platforms in a consistent way, say by meeting with one working group on MS Teams and another on Zoom. It’s not as strong of a difference as meeting in different rooms, but it’s still a change of venue. Another way to accomplish the same goal is to simply change the appearance of my computer each time you meet with a person, use different backgrounds for different people, or light view for “work”, dark view for “home”. These seem like very small things and they might not fix the problem entirely, but they could help.

I thought about working in my university office, maybe once a week, and do my Zoom-based grad advisory meetings that way. Maybe that will help create a good context cue. Though I have to say, I like my home office setup with my cat, no driving commute, and unlimited coffee. The other issue with working on campus is that if we have another lockdown, I have to start over again from home. I really want to make it work from home. I need to find new ways to work, not try to work the old way.

I’m willing to try different things to help bring some better sense of structure to my online life. Like it or not, this is how a lot of us are working now and for the foreseeable future.

I would be interested in hearing your suggestions and other ideas.

The Scientific Workflow: A Guide for Psychological Science

When new students or postdocs enter into your lab, do you have a plan or a guide for them? I have a lab manual that explains roles and responsibilities, but I did not (until recently) have a guide for how we actually do things. So I’ve made it my mission in 2019 and 2020 to write these things down and keep them updated. The Lab Manual (see above) is about roles and responsibility, mentorship, EDI principles, and lab culture.

This current guide, which I call the Scientific Workflow, is my guide for doing psychological science.  I wrote this to help my own trainees after a lab meeting last where we discussed ideas around managing our projects. It started as a simple list, and I’m now making it part of my lab manual. You can find a formatted version here, and the LaTex files here.

IMG_20191029_075744

Nothing related to science here, but a beautiful picture of campus from our research building

Introduction

This is my guide for carrying out cognitive psychology and cognitive science research in my lab. The workflow is specific to my lab, but can be adapted. If you think this is helpful, please feel free to share and adapt for your own use. You can keep this workflow in mind when you are planning, conducting, analyzing, and interpreting scientific work. You may notice two themes that seem to run throughout the plan: documenting and sharing. That’s the take home message: Document everything you do and share your work for feedback (with the group, your peers, the field, and the public). Not every project will follow this outline, but most will.

Theory & Reading

The first step is theory development and understanding the relationship of your work to the relevant literature. For example, my research is based in cognitive science and I develop and test theories about how the mind forms concepts and categories. My lab usually works from two primary theories. 1) Prototype / exemplar theory , which deals with category representations; and 2) multiple systems theory (COVIS is an example) which addresses the category learning process and rule use. I follow these topics on line and in the literature.

Screen Shot 2020-01-18 at 6.49.03 AM

Paperpile is a great way to organize, annotate and share papers. See my article here.

You should keep up with developments in the field using Google Scholar alerts and its recommendations. I check every week and I recommend that you do as well. We want to test the assumptions of these theories, understand what they predict, test their limitations and contrast with alternative accounts. We’re going to design experiments that help understand the theory, the models, and make refinements and/or reject some aspects of our theories.

  • Use Google Scholar to find updates that are important for your research.
  • Save papers in Paperpile (or Zotero) and annotate as needed.
  • Document your work in Google Docs (or another note taking app).
  • Share interesting papers and preprints with the whole lab group in the relevant channel(s) in Slack.

Hypotheses Generation

Hypotheses are generated to test assumptions and aspects of the theory and to test predictions of other theories. The hypothesis is a formal statement of something that can be tested experimentally and these often arise from more general research questions which are often broad statements about what you are interested in or trying to discover. You might arrive at a research question or an idea while reading a paper, at a conference, while thinking about an observation you made, or by brainstorming in an informal group or lab meeting.

IMG_20190529_095011

A lab meeting with my student learning fNIRS

Notice that all of these assume you that put in some time and effort to understanding the theory and then allow some time to work over ideas in your mind, on paper, or in a computer simulation.

  • Work on hypothesis generation in lab meetings, our advisory meetings, and on your own.
  • Document your thoughts in Google Docs (or your own notes on paper, OneNote or Evernote).
  • Share insights in lab meetings and in the relevant channel in Slack.

Design the Study/Experiment

Concurrent with hypothesis generation is experimental design. In most case, we are designing experiments to test hypotheses about category representation and category learning and/or the predictions of computational models. We want to test hypothesis generated from theories and also carry out exploratory work to help refine our theories. Avoid the temptation to put the cart before the horse and come up with experiments and studies that will produce an effect for its own sake. We don’t just want to generate effects.

The design comes first. Consider the logic of your experiment, what you plan to manipulate, and what you want to measure. Avoid the temptation to add in more measures than you need, just to see if there’s an effect. For example, do you need to add in 2-3 measures of working memory, mood, or some demographic information just to see if there’s an effect there? If it’s not fully justified, it may hurt more than help because you have non-theoretically driven measures to contend with. I’ve been guilty of this in the past and it always comes back to haunt me.

  • Work on experiment generation in lab meetings, advisory meetings, on your own.
  • Document your work and ideas in Google Docs or a note taking app that you can share.
  • Use G*Power to estimate correct sample size.
  • Use PsychoPy or Qualtrics to build your experiment.
  • Test these experiment protocols often, on your self, on lab mates, on volunteers
  • Develop a script for research assistants who will be helping you carry out the study.
  • Share insights in lab meetings and in the relevant channel in Slack.
  • Organize tasks and chores in the relevant Trello board for your project.

Analysis Plan & Ethics Protocol

This is where we start to formalize things. An analysis plan will link together the hypothesis and the experimental design with the dependent variables and/outcome measures. In this plan, we’ll describe and document how the data will be collected, visualized, analyzed, stored and shared. This plan should describe how we will deal with outlier data, missing data, data from participants who did not complete the experiment correctly, experimenter error, malfunction, etc. This plan can include tentative predictions derived from a model and also a justification of how we intend to analyze and interpret the data. This plan can also be pre-registered with OSF, which is where we’ll plan to share the data we collect with the scientific community.

At the same time we also want to write an ethics protocol. This is a description of our experiment, the research question, and procedures for the University REB. This will also include standardized forms for information and consent, a policy for recruitment, subject safety, data storage and security. The REB has templates and examples, and our lab Slack channel on ethics can include examples as well. Use templates when ever possible.

Both of these documents, the analysis plan and the ethics protocol, should describe exactly what we are doing and why we are doing it. They should provide enough information that someone else would be able to reproduce our experiments in their own lab. These documents will also provide an outline for your eventual method section and your results section.

  • Document your analysis plan and ethics protocol work in Google Docs.
  • Link these documents to the project sheet or Trello board for your project.
  • Share in the relevant channel in Slack.

Collect Data

Once the experiment is designed, the stimuli have been examined, we’re ready to collect data or to obtain data from a third party (which might be appropriate for model testing). Before you run your first subject, however, there are some things to consider. Take some time to run yourself through every condition several times and ask other lab members to do the same. You can use this to make sure things are working exactly as you intend, to make sure the data are being saved on the computer, and to make sure the experiment takes as long as planned.

When you are ready to collect data for your experiment:

  • Meet with all of your research volunteers to go over the procedure.
  • Book the experiment rooms on the Google Calendar.
  • Reserve a laptop or laptops on the Google Calendar.
  • Recruit participants though SONA or flyers.
  • Prepare the study for M-Turk or Prolific
  • Use our lab email for recruitment.

After you have run through your experiment several time, documented all the steps, and ensured that the everything is working exactly as you intended, you are ready to begin. While you are running your experiment:

  • Document the study in Google Docs, Trello, and/or Slack (as appropriate)
  • Make a note of anything unusual or out of the ordinary for every participant in a behavioural study.
  • Collect signatures from participants if you are paying them.
  • Data should stored in text files that can be opened with Excel or Google sheets or imported directly into R. Be sure these are linked to the project sheet.
  • Make sure the raw data are labelled consistently and are never altered.
  • Be sure to follow the data storage procedures outlined in the ethics protocol.

Data Management

Your data plan should specify where and how to store your data. While you are collecting data you should be working on a script in R (or Python) to extract and summarize the raw data according to your plan. When you reach the planned sample size, ensure that all of that data are secure and backed up and do an initial summary with your R script.

As you work on summarizing and managing your data:

  • Make notes in the project sheet and/or Trello board about where the data are stored
  • Document your steps in an R Notebook (or Python Notebook).

Plots & Stats

Remember the photo of Dr. Katie Bouman, then a postdoc, when she first saw the rendering of the first photos of a black hole that her algorithms generated? That’s the best part of science: seeing your data visualized for the first time. When you have completed your experiment and taken care of the data storage and basic processing, it’s time to have fun and see what you discovered. The analysis plan is your guide and your analysis plan describes how you want to analyze the data, what your dependent variables are, and how to conduct statistical test with you data to test the hypothesis. But before you do any statistics, work on visualizing the data. Use your R notebook to document everything and generate boxplots, scatter plots, or violin plots to see the means, medians, and the distribution for the data.

Because you are using R Notebooks to do the analysis, you can write detailed descriptions of how you created the plot, what the plot is showing, and how we should interpret the plot. If you need to drop or eliminate a subject’s data for any reason, exclude them in from data set in R, do not delete the data from the raw data file. Make a comment in the script of which subject was dropped and why. This will be clear and transparent.

You can also use R to conduct the tests that we proposed to use in the analysis plan. This might be straightforward ANOVA or t-test, LME models, regression, etc. Follow the plan you wrote, and if you deviate from the plan, justify and document that exploratory analysis.

If you are fitting a decision boundary model to your data, make sure you have the code for the model (these will be on my GitHub) and you should do your modelling separately from the behavioural analysis. The GLM models are saved as R scripts but you should copy or fork to your R-Notebooks for your analysis so you can document what you did. Make sure that you develop the version for your experiment and that the generic model is not modified.

If you are fitting a prototype or exemplar model, these have been coded in Python. Use Python 3 and a basic text editor or JupyterLab. JupyterLab might be better as it’s able to generate markdown and reproducible code like R Notebooks. Or just call python from R Studio.

  • Follow your analysis plan.
  • Consult with me or your peers if you notice any unusual patterns with anything.
  • Make notes in the project sheet and/or Trello board about what analyses you’ve completed.
  • Document your steps in an R Notebook (or Python Notebook).
  • If you drop a participant for any reason, indicate in the comments of your R script (or other notes). We want this information to recorded and transparent.

Present and Explain Your Work

While you working on your analysis, you should present the interim work often in lab meetings for the rest of the group and we can discuss the work when we meet individually. The reason to present and discuss often is to keep the ideas and work fresh in your mind by reviewing manageable pieces of it. If you try to do too much at once, you may miss something or forget to document a step. Go over your work, make sure its documented, and then work on the new analyses, and repeat. You should be familiar with your data and your analysis so that you can explain it to yourself, to me, to your peers, end eventually anyone who reads your paper.

Use the following guidelines for developing your work:

  • Make your best plots and figures.
  • Present these to the lab on a regular basis.
  • Use RPubs to share summary work instantly with each other and on the web
  • Keep improving the analysis after each iteration.
  • You should always have 8-10 slides that you can present to the group.
  • Document your work in R Notebooks, Google Docs, Trello, and Google Slides.

Write Papers Around This Workflow

The final step is to write a paper that describes your research question, your experimental design, your analysis, and your interpretation of what the analysis means. A scientific paper, in my opinion has two important features:

  1. The paper should be clear and complete. That means it describes exactly what you wanted to find out, how and why you designed your experiment, how you collected your data, how you analyzed your data, what you discovered, and what that means. Clear and complete also means that it can be used by you or by others to reproduce your experiments.
  2. The paper should be interesting. A scientific paper should be interesting to read. It needs to connect to a testable theory, some problem in the literature, an unexplained observation. It is just as long as it needs to be.

I think the best way to generate a good paper is to make good figures. Try to tell the story of your theory, experiment, and results with figures. The paper is really just writing how you made the figures. You might have a theory or model that you can use a figure to explain. You can create clear figures for the experimental design, the task, and the stimuli. Your data figures, that you made according to you analysis plan, will frame the results section and a lot of what you write is telling the reader what they show, how you made them, and what they mean figures. Writing a scientific paper is writing a narrative for your figures.

Good writing requires good thinking and good planning. But if you’ve been working on your experiment according to this plan, you’ve already done a lot of the thinking and planning work that you need to do to write things out. You’ve already made notes about the literature and prior work for your introduction. You have notes from your experimental design phase to frame the experiment. You have an ethics protocol for your methods section and an analysis plan for your results. You’ll need to write the discussion section after you understand the results, but if you’ve been presenting your 8-10 slides in lab meeting and talking about them you will have some good ideas and the writing should flow. Finally, if you’ve been keeping track of the papers in Paperpile, your reference section should be easy.

Submit the paper

The final paper may have several experiments, each around the theme set out in the introduction. It’s a record of what we did, why we did it, and how. The peer reviewed journal article is the final stage, but before we submit the paper we have a few other steps to ensure that our work roughly conforms to the principles of Open Science, each of which should be straightforward if we’ve followed this plan.

  • Create a publication quality preprint using the lab template. We’ll host this on PsyArXiv (unless submitting a blind ms.)
  • Create a file for all the stimuli or materials that we used and upload to OSF.
  • Create a data archive with all the raw, de-identified data and upload to OSF.
  • Upload a clean version of your R Notebook that describe your analyses and upload to OSF.

The final steps are organized around the requirements of each journal. Depending on where we decide to submit our paper, some of these may change. Some journals will insist on a word doc file, others will allow for PDF. In both cases, assume that the Google Doc is the real version, and the PDF or the .doc files are just for the journal submission. Common steps include:

  • Download the Google Doc as a MS Word Doc or PDF.
  • Create a blind manuscript if required.
  • Embed the figures if possible otherwise place at the end.
  • Write a cover letter that summarizes paper and why we are submitting.
  • Identify possible reviewers.
  • Write additional summaries as required and generate keywords.
  • Check and verify the names, affiliations, and contact information for all authors.
  • Submit and wait for 8-12 weeks!

Conclusion

As I mentioned at the outset, this might not work for every lab or every project. But the take home message–document everything you do and share your work for feedback–should resonate with most science and scholarship. Is it necessary to have a formal guide? Maybe not, though I found it instructive for me as the PI to write this all down. Many of these practices were already in place, but not really formalized. Do you have a similar document or plan for your lab? I’d be happy to hear in the comments below.

Use Paperpile’s Annotation System

Reading scientific papers as PDFs is a major part of being an academic. Professors, postdocs, grad students and undergraduates end up working with PDFs, making notes, and then using those notes to write a manuscript or paper. Although there are lots of great PDF viewers and reference managers, I use Paperpile, which is cloud-based PDF manager and was originally designed to be a reference manager for Google Docs. It can sync all your PDFs with your Google Drive (so you can read them offline) and neatly integrates with Google Scholar and Chrome so that you can import references and PDFs from anywhere. It handles citations in Docs and in Word and has a beta app for iPad that is brilliant.

We use this in my lab all the time. It’s a paid app, but it is not very expensive, they have education pricing and as the lab PI, I just pay for a site license for all my trainees.

Making Notes

One of the best features is the notes-taking and annotation system. Like most PDF viewers, the built in PDF viewers lets you highlight, markup, and annotate PDFs with sticky notes. These annotations stay with the PDF and will sync across devices because it’s cloud based. Just like in Adobe or Apple Preview, you can highlight, add notes, use strike-thru, or even draw with a pencil. Paperpile organizes these well and makes it easy to navigate. And if you use the iPad app you can make notes there that will show up in the browser and notes in the browser will show up on the iPad. The icon on the upper right hides your notes.

Screen Shot 2020-01-18 at 6.49.03 AM

Exporting and Sharing

If you’re reading along, taking notes and making highlights, you may want to share these with someone or use them in a manuscript (or even a manuscript review). There are several ways to do this.

Export the PDF

The File menu lets you print with or without annotations. If you want to send the PDF to someone as a clean PDF without your notes, that’s easy to do. Or it will save your notes in the new PDF.

Screen Shot 2020-01-18 at 6.49.58 AM

The exported PDF opens in other PDF viewers with your notes intact and editable (Apple Preview is shown below). This is great to share with someone who does not use Paperpile. Of course, you can print a clean PDF without the annotations.

Screen Shot 2020-01-18 at 6.51.12 AM

Export the annotations only

If you planning to write an an annotated bibliography, a critical review, a meta analysis, a paper for class or even a manuscript review for a journal, the ability is export the notes is invaluable. Using the same File menu, you will see the “export” option. This lets you export just your notes and highlights in several formats. If you want it to share on line, for examples, try the HTML option. This is great if you are writing a blog and wanted to include screen shots and notes. Notice that this keeps the annotations (notes, images, highlights) on the right and data about who made the notes on the left. Helpful if more than one person are making notes.

Screen Shot 2020-01-18 at 7.10.12 AM And of course, if you’re using this annotation tool to make notes for your own paper or a manuscript review, you can export just your notes as text or markdown and open in Google Docs, Word, or any editor and use those to help frame your draft. You have the contents of the notes as text and can quote highlighted text. Images are not saved, of course.

Conclusion

In my opinion, Paperpile is the best reference manager and PDF manager on the scene. Others, like Zotero, Mendeley, and Endnote are also good (and Zotero is free, of course). Each has things they do really well, but if you already use Paperpile, or are curious about it, I strongly suggest you spend some time with the PDF viewer and annotations. It’s really changed my workflow for the better. It’s just such well designed software.


Comments, corrections, and suggestion are always welcome.

There Are Two Kinds of Categorization Researchers

Dual process accounts of cognition are ubiquitous. In fact the one thing you can count on is that there are two kinds of cognitive scientists: Those who think there are two systems and those who don’t.  My research has generally argued for the existence of two systems. Though the more I do research in this area the less convinced I am.

With that in mind, I really enjoyed reading this new paper from Mike Le Pelley and Ben Newell at UNSW and Rob Nosofsky at IU. They are commenting on an earlier paper by J. David Smith, Greg Ashby and colleagues. In this blog post, I’m going to review both of them, and argue that neither one of them gives us a complete picture.  Both are also missing a critical question.

The Multiple Systems Approach

Smith’s paper reported on an experiment in which they asked people to learn perceptual categories that either had a single dimensional rule, or a two-dimensional structure that could be learned without a rule. Subjects learned under one of two conditions. Either they received feedback immediately after making a classification,  or feedback was deferred and delivered after five trials in a row.

Screen Shot 2019-07-31 at 1.08.01 PM

The figure above, which I copied from their paper, illustrates the conceptual structure of each category set. Panel A shows the 1-dimensional linear boundary between the two clusters of exemplars (a rule) and panel B shows a 2-dimensional, diagonal boundary between the two cluster of exemplars,  which is not an easily verbalized rule.

The actual images subjects saw were pixel displays that varied in size and density. The figure below shows the full range, and you can imagine that in the single dimensional case,  you would learn to categorize slightly larger things as belonging to one group and slightly smaller things as belonging to the other group, and you would ignore density. For the non rule defined (information integration) categories you would incorporate both size and density. To leann, you see a single stimulus in the screen and respond with Category A or B and then feedback (or not).  This continues for a few 100 trials

Screen Shot 2019-07-31 at 1.10.53 PM

What they discovered was that when feedback was immediate, people learning the rule described set (panel B) tended to learn the rule and people learning the diagonal category set (panel B) learned the diagonal boundary, just as expected. But when feedback was deferred, it only seemed to affect the diagonal boundary. Most subjects who learned the diagonal category set with deferred feedback were unable to learn the diagonal boundary. Instead, most seem to learn some kind of single dimensional boundary that was suboptimal.  In the figure below, panels A and B show that immediate and deferred feedback did not seem to affect performance on the rule-based category set. Figure panels C and D show that deferred feedback seem to make it nearly impossible for participants to learn the correct diagonal boundary. Figure panel D shows that no subjects who learned the diagonal categories actually seemed to be using the optimal diagonal boundary. In other words, the deferred feedback ruined their performance.

Screen Shot 2019-07-31 at 1.12.25 PM

Smith and colleagues interpreted this as evidence for two systems that underlie the category learning process. One system relies on verbal working memory and is able to learn the rule defined structure. It’s not affected by the deferred feedback because subjects can hold the responses that they made in working memory until the feedback is delivered. But the diagonal case depends on the implicit associative learning system. This system relies heavily on a hypothesized dopaminergic learning system. In order for that to work, there needs to be a temporal proximity between stimulus, response, and feedback. When you disrupt that by deferring the feedback delivery you disrupt the learning process. Smith and colleagues argued this was one of the strongest associations in the literature.

They write:

“We hypothesized that deferred reinforcement should disable associative learning and the II category learning that depends upon it. Deferred reinforcement eliminated II category learning. There may be no comparably strong demonstration in the literature.
We hypothesized that RB learners hold their category rule in working memory, still
allowing its evaluation for adequacy at the end of the trial block when deferred
reinforcement finally arrives. Confirming this hypothesis, RB learning was unscathed by
deferred reinforcement.”

I read this paper when it first came out and I agreed with them. I thought it was a terrific case.

Evidence against the multiple system approach

The new paper that was just published by Mike Le Pelley and colleagues argues that the dissociation is not as strong as it seems. Or rather, it doesn’t support the existence of two systems. According to their approach, all of the learning happens within the same system but the more cognitively demanding the task is, the more likely it is to rely on some of the executive functions, or working memory.  The single dimensional rule is fairly easy to learn and so it’s not affected by the deferred feedback intervention. The diagonal, information integration category set is more cognitively demanding and so it is affected by the deferred feedback intervention. They went one step further. They asked a group of subjects to learn a third category set. One that is cognitively demanding but one that can be learned by explicitly verbalizable rule. I have used a category set like this in the past, and also argue that it engages an explicit category learning system.

Le Pelley et al’s  three different category sets are shown below. On the left, the single dimensional vertical rule. In the middle, the diagonal rule, and on the right a two-dimensional conjunctive structure.Screen Shot 2019-07-31 at 1.13.05 PM

They asked their subjects to learn images that were single blue lines on the screen. These blue lines varied in length (which corresponded to the X axis on the plots above) and the angle of the line on the screen (which corresponded to the y-axis on the plot above) They also asked subjects to learn these in either the immediate feedback condition or the deferred feedback condition, the same as Smith and colleagues.

Their data are shown below. As you can see, the deferred feedback did not interfere with the single dimensional category set. Participants are performing well in both conditions and the majority of them are using a optimal linear boundary (the “best fitting model”). And just like Smith et al., they found that the deferred feedback condition interfered strongly with performance on the diagonal set. Performance was reduced and people were less likely to use the optimal diagonal boundary.

Screen Shot 2019-07-31 at 1.14.54 PM

However there’s a twist: the deferred feedback also interfered with the conjunctive rule category set.  This undermines a multiple system approach. If subjects were learning these rule defined categories with an explicit verbal system that was not affected by the deferred feedback, performance on this categories that should not have been affected. but it was.  The figure shows that performance was reduced, and people were less likely to use the optimal two-dimensional conjunctive boundary when receiving deferred feedback. The main difference between that category set and the diagonal category set is that they are both complex two-dimensional complex structures.

Or as they write:

“These findings do not follow from Smith et al.’s multiple-systems account but follow naturally from a cognitive-demands account: The cognitive complexity and memory demands of diagonal and conjunction tasks are greater than for the vertical task, so deferring feedback will impair both two-dimensional tasks and may drive participants to a less-demanding unidimensional strategy.”

My Interpretation

My impression is that these are both really well done studies. The original paper by Smith et al. tested a clear hypothesis of the multiple systems approach. They equated their category sets for complexity and difficulty and only interfered with the delivery of the feedback. And consistent with the procedural nature of the implicit system, only the non-rule defined set was affected. As well, this result is broadly consistent with research from my lab, Smith’s lab, Ashby’s lab, and many others.

But are do these data imply two separate systems? Although the complexity of the conceptual structure was equated in Smith’s design, the representations that were required to learn the category set were not. People learning the diagonal rule had to learn more than one dimension and when Le Pelley et al. asked participants to learn a two-dimensional rule described set, they found evidence of deferred feedback interference. That seems broadly inconsistent with the multiple systems approach.  When feedback was immediate, participants could learn the conjunctive role and they did so by primarily defending a two-dimensional conjunctive rule boundary. When the feedback was deferred, their performance was reduced and they lost access to the two-dimensional conjunctive rule.

However these aren’t really compatible studies in my view. Why?

  • First of all the category sets, although similar in a broad sense, are not equivalent. The boundaries were more separable and the exemplars were more tightly clustered in perceptual/psychological space in Smith’s paper. The cluster of exemplars in Le Pelley’s work was broader and and more diffuse.
  • Secondly, there may be a difference between learning to classify a single line on the screen (Le Pelley) that varies by length and orientation compared to a rectangle (Smith) that varies in terms of pixel density and size. I don’t know if this makes a difference. There may be an emergent dimension in Smith’s case, some combination of size and density that is not controlled for.

These are not problems in and of themselves, but they do make it difficult to determine whether or not Le Pelley’s work is a clear or challenge to Smith’s work. It seems to be, but someone needs to run the exact same edition to see if Smith’s work is replicable. or the reverse, it might be worth looking at whether or not the pixel density rectangles allow for Le Pelley is work to be replicated.

One of the things I like best about Le Pelley’s work is that the data were collected online. and all of the data and modelling scripts are available and open. You can even look at an example of the study they ran and for yourself.  I hope to see more studies like this.  you may even see more studies like this from my lab. As we are designing some tasks that will work this way.

Unanswered Questions

I said at the outset I thought that they’re missing an important part of the question.  One of the most interesting things to me is how and why participants adopt different strategies. In some cases, there is a clear and easy optimal rule. But often only 60% or 70% of the subjects find that rule. Why? And those that don’t find the rule often use another strategy, one that is suboptimal. Why and how to they choose? What individual difference, cognitive difference, or local variable allows you to predict whether or not participants will find the optimal boundary? I think that’s a really unexplored question. Neither of these two studies get at that, and that seems to be orthogonal to the multiple systems approach it strikes me as an area ripe for investigation.

I’ll add it to my list…


Summer Running or Winter Running: Which is Better?

I love running outside, but each season is different. And where I live, Southern Ontario, we get quite a range, with summer high temperatures up to the mid 30Cs (mid 90s in F) and wintertime lows can be -25C or lower (-13F and lower). I run all year long, so I decided to compare the to decide which was the best season for running.

A few Caveats (YMMV)

First, it should be self evident that late September – early October is actually the best time for running. It’s the best time for a lot of things. The weather is beautiful. It’s not too hot not too cold. The air is usually crisp. The days are getting shorter, but not too short. And maybe there’s some evolutionary need to get out and run, as if we need to get out and gather nuts and game meat for the long winter. Who knows, I’m not an evolutionary psychologist so I’m just making that up.

IMG_20181104_104002-EFFECTS

This is why October is everyone’s favourite Month

Second, I have to acknowledge that I have the ability and privilege to run all year. I’m able and I’m reasonable fit for 49 years old. Not everyone has that. I am fortunate to live in a city with places to run. I am fortunate to live in a city that usually plows the sidewalks even after 2 feet of snow and even plows some of the running / multi-use trails also. Not everyone has that. As well, as a white, middle age male, I can run alone without worrying about being hassled, harassed, or feeling like a suspect. Not everyone has that privilege. And I run with my wife sometimes too: it’s great have a partner.

So let’s get to it. Which is the best season for running: Summer or Winter?

Summer

Summer is a like a long weekend. June is your Friday afternoon, full of promise and excitement. July is a Saturday, it’s fun, long, and full. Yes there’s summer chores to be done and in the back of your mind, you know the end is coming, but hey, it’s summer. August is Sunday. Enjoy your brunch, but soon it’s back to school, back to reality.

Weather: Its warm and pleasant some days, but miserable on other days. A sunny day at +25 is wonderful, but a humid day with a heat index of +44C is not fun to run in. You need to get out early or late to find cooler temps in those long, hot July weeks. If you wait too long, it’s too hot.

Gear: Shorts, light shirt, quick dry hat, water, and sunscreen. That’s it. You need the hat or something to keep sweat from pouring down your face. You need to carry water, also  because you’ll be sweating.

Flora: Summer is full of life and greenery here in the Great Lakes region. There are flowers and beautiful leafy shade trees. The scent of blossoms is in the air. But there’s pollen in the air too, and that can make it hard to breath. Some days in June, I sneeze every few minutes.

IMG_20190712_194125

Summer trail runs can be sublime

Wildlife: Good and bad. You can see deer in the woods, and birds, rabbits, foxes and coyotes. That’s the good. But you will be bothered by mosquitos and flies. And if you run on trails, there are spiders and ticks. Many of my long trail runs include running through webs and brushing off spiders. Not fun. I also do a tick check.

Air: It smells great early on, as jasmine-scented summer breezes envelop you on an early morning run. But it’s also muggy, hard to breath, and ozone-y. Around here, the air can smell of pig manure (we live near agriculture) and skunks. Lots of skunks.

Risk of weather death: Low, but people do die every year because of exhaustion. Heat stroke is real possibility, though

Distractions: Mixed. On the one hand, as a university professor I have more flexibility in the summer because I am not lecturing. But there’s also more outside stuff to do. Lawn work, garden work, and coaching softball. The beach. Biking places. I feel less compelled to run on a day when I had to mow the lawn and take care of other summer chores.

Overall: Summer running is great in late May, and early June but it soon turns tedious and to be honest by July it begins to feel like a chore. The hot weather can really drain the will to move.

IMG_20190720_093157

Hot humid by the Springbank bridge in London, ON.

Winter

Winters seem very long here, even in the southern part of Canada. The days are short; the nights are long. January can seem especially brutal because the holidays are over and winter is just beginning.

Weather: Extremely variable. More so than summer. You might get a stretch of “mild” days where its -10C followed by two weeks of -25C with brutal wind. You can run in that, but the toughest part is just getting out the door. Late winter is warmer, but that presents another problem. The sidewalk or trail will melt and thaw during the day and freeze as soon as the sun goes down. A morning run or an evening run means dealing with a lot of ice.

IMG_20190126_075944

It’s cold and dark but so beautiful

Gear: Tights, windpants, hat, gloves, layers, layers, and layers. A balaclava and sunglasses might be needed. That means more laundry. Carrying water is not quite as crucial as in the summer, but you may still need to, because public rest areas will not have their water fountains turned on. The water can freeze, which is not good (and has happened to me). Ice cleats or “yak tracks” can help if you’re running on a lot of packed snow and ice

Flora: There will be evergreens and that’s pretty much it. No pollen but no shade either. And nothing to block the wind.

Wildlife: Mostly good, but there’s less of it. You’ll see cardinals and squirrels and even deer. No bugs or spiders or skunks. But in Canada, (London, ON) the geese will start to get very aggressive as they get closer to mating in the spring… Avoid!

Air: Crisp and clear. But -25C and below, it can take your breath away. You warm up quickly and it really feels great to breath the cold air.

Risk of Weather Death: Pretty low, but black ice is treacherous. You can slip and fall and really hurt yourself. Also, be aware that windchill is a real thing. A windchill of -45C is dangerous.

Distractions: Mixed. I’m busier at work, but not outside as much and so I feel more compelled to run.

Overall: Winter has many challenges, but running is offset by an elusive quality that getting outside will be an adventure.

Conclusions

The Winner: Winter running is better.

There are pros and cons to each season. But I find it easier and more enjoyable to run in the dead of winter than in the hazy days of summer.

IMG_20190126_084512

I look happy, even after a long cold run.

One reason winter is best is how the weather extremes differ in the summer and winter. Unless I go out really early or really late, a morning run in the summer means that the weather gets objectively worse as I run. Try to do an 18km run at 8:00am and by 9:30 is really getting hot! You feel exhausted. Winter is the reverse. It gets nicer and slightly warmer as I go, so I feel exhilarated.

Another reason that winter is better is just a survival feeling. Winter feels like an adventure. I have to suit up and carry more gear and I might be the only one out on a trail. Summer, on the other hand feels like a chore. Like something I have to do. I have to get the run in before it gets too hot.

My stats bear this preference out.

In January I average 40-50km/week. In July it’s between 25-30km/week. My long runs are longer in the winter. I think its because I’m just not outside as much in the winter and so the long runs keep me sane. In the summer, I’m mowing, walking, coaching, and just doing more stuff. There’s less need to run.

So that’s it. Winter running is better than summer running. But this is just my opinion. What are your thoughts? Do you agree? Do you like running when it’s hot out? Do you hate being bundles up for winter runs?

In the end it does not matter too much as long as you’re able to get outside and enjoy a run, a walk, or whatever.


Mindful University Leadership

Academia, like many other sectors, is a complex work environment. Although universities vary in terms of their size and objectives, the average university in the United States, Canada, UK, and EU must simultaneously serve the interests of undergraduate education, graduate education, professional education, basic research, applied research, public policy research, and basic scholarship. Most research universities receive funding for operation from a combination of public and private sources. For example, my home university, The University of Western Ontario, receives its operating funds from tuition payments, governments, research funding agencies, and from private donors. Many other research universities are funded in similar ways, and most smaller colleges are as well.

IMG_20180728_204415-EFFECTS

Looking west over Lake Erie, Port Stanley, Ontario

Faculty are at the center of this diverse institution, acting as the engine of teaching, research, and service. As a result, faculty members may find themselves occasionally struggling to manage these different interests. This article looks at the challenges that faculty members face, paying particular attention to the leadership role that many faculty play. I then explore the possible ways in which a mindfulness practice can benefit faculty well-being and productivity.

Challenges of Leadership in the University Setting

Although many work environments have similar challenges and issues (being pulled in different directions, time management, etc.) I want to focus on the challenges that faculty members face when working at and leading the average, mid-sized or large university. The specific challenges will vary in terms of what role or roles a person is serving in, but let’s first look at challenges that might be common to most faculty members.

Challenge 1: Shifting tasks

“Email is a wonderful thing for people whose role in life is to be on top of things. But not for me; my role is to be on the bottom of things. What I do takes long hours of studying and uninterruptible concentration.” — Donald Knuth

I love this quote from Donald Knuth, a professor of computer science, because it encapsulates the main challenge that so many of us have. We want to be on top of things (teaching, questions from students, cutting-edge research) but we also want to be on the bottom: digging deeply into a problem and finding a solution.

The average faculty member has, at a minimum, 2–3 very different kinds of jobs. We’re teachers, researchers/scholars, and we also help to run the university. Within these broadly-defined categories, we divide our teaching time between graduate and undergraduate teaching and mentorship. Research involves investigation, applying for grants, reading, investigation, analysis, writing, dissemination. And running the university can make us managers, chairs, deans, and provosts and as such, we’re responsible for hiring research staff, hiring other faculty members, and managing budgets.

These three categories require different sets of skills and shifting between them can be a source of stress. In addition, the act of shifting between them will not always go smoothly and this may result in a loss of effectiveness and productivity as the concerns from one category, task, or role bleed into another. Being mindful of the demands of the current task at hand is crucial.

For example, I find it especially difficult to transition after 2–3 hours of leading a seminar or lecture. Ideally, I would like to have some time to unwind. But many times, I also need to schedule a meeting in the afternoon and find that I have only a short amount of time to go from “lecture mode” into “meeting mode”. Worse, I might still be thinking about my lecture when the meeting begins (this is an even bigger challenge for me in 2020, because nearly everything is online, on Zoom, from my home office). Even among university leaders that have little or no direct teaching requirements, it is common to have to switch from and to very different topics. One day you might start the day answering emails (with multiple topics), a morning meeting on hiring negotiations, a meeting about undergraduate planning, then an hour with a PhD student on a very specific and complex analysis of data for their dissertation research, followed by a phone call from the national news outlet asking about the research of one of your faculty members. Shifting between these tasks can reduce your effectiveness. The cognitive psychology literature refers to this as “set shifting” or “task-shifting”, and research has supported the idea that there is always a cost to shift (Arrington & Logan, 2004; Monsell, 2003).  These costs will eventually affect how well you do your job and also how you deal with stress. It’s difficult to turn your full attention to helping your student with an analysis when you are also thinking about your department’s budget.

As academics, we switch and shift tasks throughout the day and throughout the week. The primary challenge in this area is to be able to work on the task at hand and to be mindful of distractions. Of course, they will occur, but through practice, it may be possible to both minimize their impact and also reduce the stress and anxiety associated with the distractions.

Challenge 2: Shared governance

One aspect of academia that sets it apart from many corporate environments is the notion of “shared governance”. Though this term is common (and has been criticized as being somewhat empty,) the general concept is that a university derives its authority from a governing board, but that faculty are also vested in the institutional decision-making process. This means that most universities have a faculty senate that sets academy policy, dean’s level committees that review budgets and programs, and departmental committees that make decisions about promotion and tenure, hiring, and course assignments.

From a leadership perspective, this can mean that as a chair or dean you are always managing personal, balancing the needs of faculty, students, budgets, senior administrators, and the public image of your university. There may not be a clear answer to the question of “who is the boss?”  Sometimes faculty are asked to assume leadership roles for a set time and will need to shift from a collegial relationship to a managerial one (then back to a collegial one) for the same people. That is, one day you are colleagues and the next you are his or her supervisor.

The challenge here is to understand that you may be manager, colleague, and friend at the same time. In this case, it’s very helpful to be mindful of how you interact with your colleagues such that your relationship aligns with the appropriate role.

Challenge 3: Finding time for research and scholarship

One of the most common complaints or concerns from faculty is that they wish they had more time for research. This is a challenge for faculty as well as leaders. Although a common workload assumes that a faculty member may spend 40% of their time on research, most faculty report spending much of their time in meetings. However, promotion and tenure is earned primarily through research productivity. Grants are awarded to research productive faculty. That is, most of those meetings are important, but do not lead to promotion and career advancement. This creates a conflict that can cause stress because although 40% is the nominal workload, it may not be enough to be research productive. Other aspects of the job, like meetings related to teaching and service, may take up more than their fair share but often feel more immediate.

In order to be effective, academic leaders also need to consider these concerns from different perspectives. For example, when I was serving as the department chair for a short period, I had to assigned teaching to our faculty. There are courses that have to be offered and teaching positions that have to be filled. And yet my colleagues still need to have time to do research and other service work. These can be competing goals and they affect different parts of the overall balance of the department. The department chair needs to balance the needs of faculty to have adequate time for research with the needs of the department to be able to offer the right amount of undergraduate teaching. So not only is it a challenge to find time to do one’s own research, a department chair also needs to consider the same for others. Being mindful of these concerns and how they come into conflict is an important aspect of university leadership.

Considering these diverse goals and trying to meet them requires a fair degree of cognitive flexibility and if you find yourself being pulled to think about teaching, about meetings, and about the workload of your colleagues, it is going to pull you away from being able to be on top of your own research and scholarship. The primary challenge in this area is to create the necessary cognitive space for thinking about research questions and working on research.

Mindfulness and Leadership

I’ve listed three challenges for leaders in an academic setting: switching, shared governance, and finding time for research. There are more, one course, but let’s stick with these. I want to now explain what mindfulness practice is and how it might be cultivated and helpful for academic leaders. That is, how can mindfulness help with these challenges?

What is mindfulness?

A good starting point for this question is a definition that comes from Jon Kabat-Zinn’s work. Mindfulness is an open and receptive attention to, and awareness of what is occurring in the present moment. For example, as I’m writing this article, I am mindful and aware of what I want to say. But I can also be aware of the sound of the office fan, aware of the time, aware that I am attending to this task and not some other task. I’m also aware that my attention will slip sometimes, and I think about some of the challenges I outlined above. Being mindful means acknowledging this wandering of attention and being aware of the slips but not being critical or judgmental about my occasional wavering. Mindfulness can be defined as a trait or a state. When described as a state, mindfulness is something that is cultivated via mindfulness practice and meditation.

How can mindfulness be practiced?

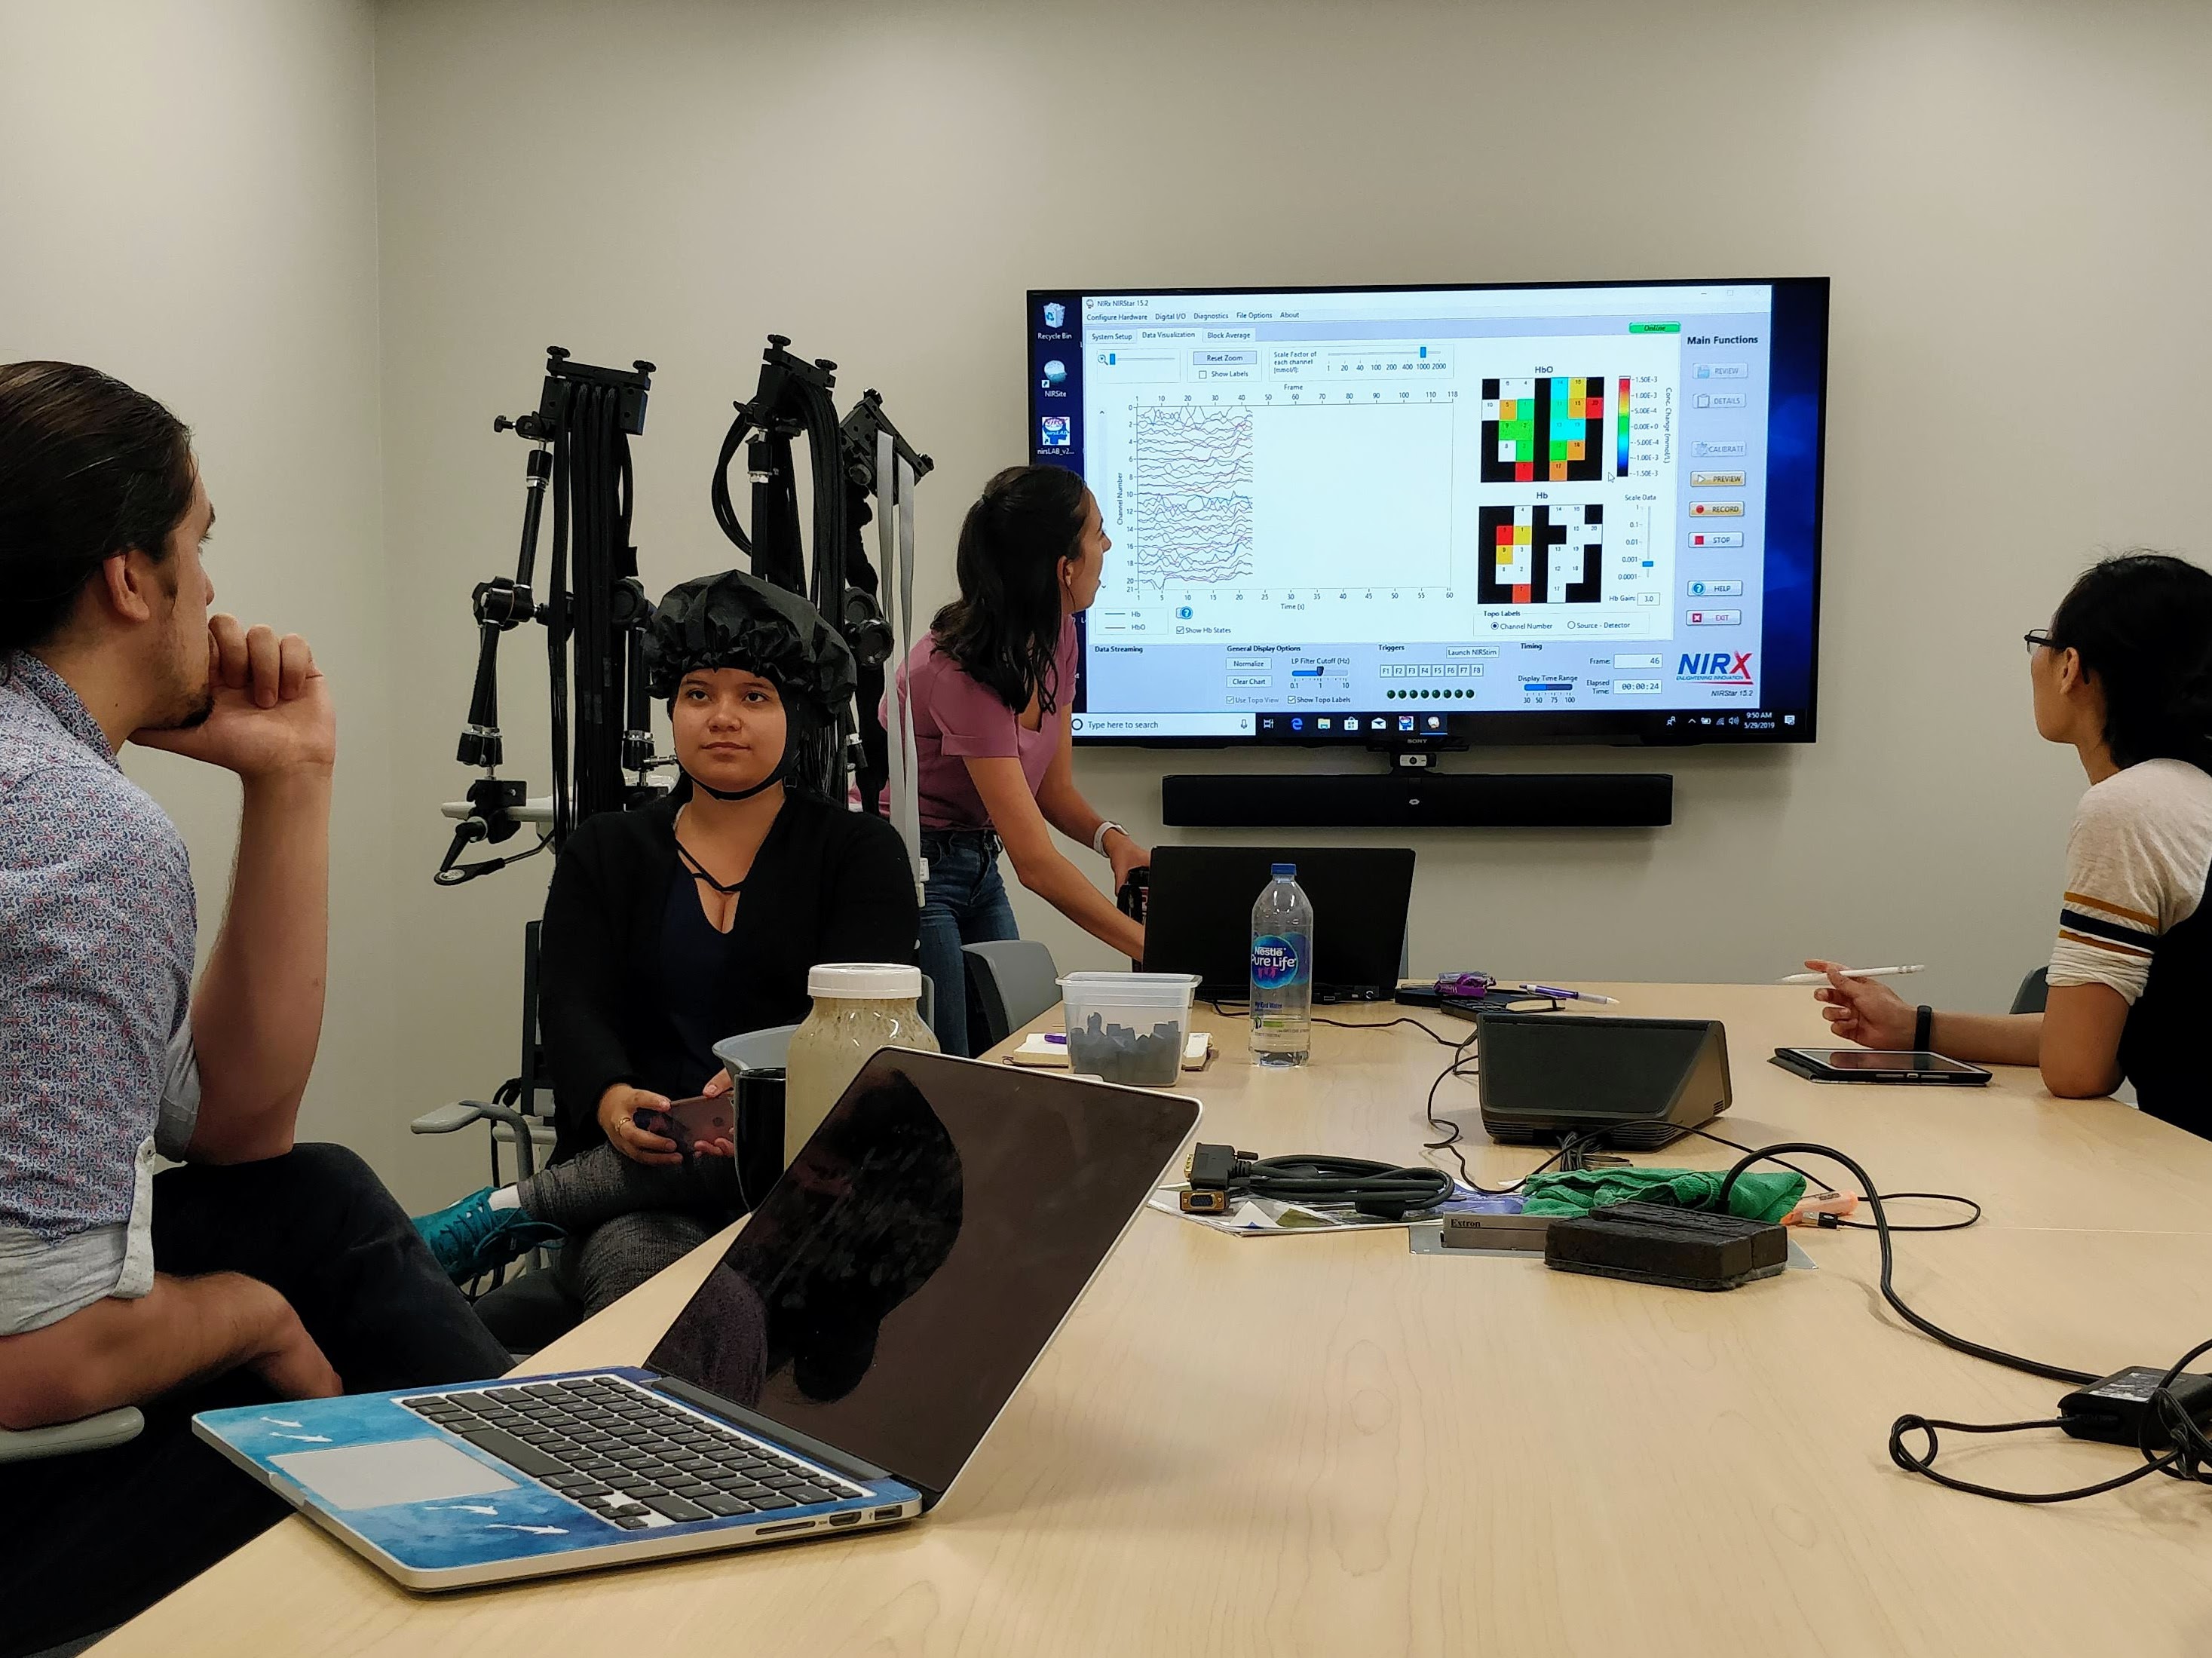
The best way to practice mindfulness is just to begin. Mindfulness can be practiced alone, at home, with a group, or on a meditation retreat. More than likely, your college or university offers drop in meditation sessions (as mine does). There are usually meditation groups that meet in local gyms and community centers. Or, if you are technologically inclined, the Canadian company Interaxon makes a small, portable EEG headband called MUSE that can help develop mindfulness practice (www.choosemuse.com). There are also excellent apps for smartphones, like Insight Timer.

The basic practice is one of developing attentional control and awareness by practicing mindfulness meditation. Many people begin with breathing-focused meditation in which you sit (in a chair or on a cushion) close your eyes, relax your shoulders and concentrate on your breath. Your breath is always there, and so you can readily notice how you breath in and out. You notice the moment where your in-breath stops and your out-breath begins. This is a basic and fundamental awareness of what is going on right now. The reason many people start with breathing-focused meditation is that when you notice that your mind begins to wander, you can pull your attention back to your breath. The pulling back is the subtle control that comes from awareness and this is at the heart of the practice. The skill you are developing with mindfulness practice is the ability to notice when your attention has wandered, not to judge that wandering, and to shift your focus back to what is happening in the present

Benefits of mindfulness to academic leaders

A primary benefit of mindfulness involves learning to be cognitively and emotionally present in the task at hand. This can help with task switching. For example, when you are meeting with a student, being mindful could mean that you bring your attention back to the topic of the meeting (rather than thinking about a paper you have been working on). When you are working on a manuscript, being mindful could mean keeping your attention on the topic of the paragraph and bringing it back from other competing interests. As a researcher and a scientist, there are also benefits as keeping an open mind about collected data and evidence which can help to avoid cognitive pitfalls. In medicine, as well as other fields, this is often taught explicitly as at the “default interventionist” approach in which the decision-maker strives to maintain awareness of her or her assessments and the available evidence in order to avoid heuristic errors. (Tversky & Kahneman, 1974) As a chair or a dean, being fully present could also manifest itself by learning to listen to ideas from many different faculty members and from students who are involved in the shared governance of academia.

Cognitive and clinical psychological research has generally supported the idea that both trait mindfulness and mindfulness meditation are associated with improved performance on several cognitive tasks that underlie the aforementioned challenges to academic leaders. For example, research studies have shown benefits to attention, working memory, cognitive flexibility, and affect. (Chambers, Lo, & Allen, 2008; Greenberg, Reiner, & Meiran, 2012; Amishi P. Jha, Stanley, Kiyonaga, Wong, & Gelfand, 2010; Amism P. Jha, Krompinger, & Baime, 2007) And there have been noted benefits to emotional well-being and behaviour in the workplace as well. This work has shown benefits like stress reduction, a reduction to emotional exhaustion, and increased job satisfaction (Hülsheger, Alberts, Feinholdt, & Lang, 2013, Nadler, Carswell, & Minda, 2020)

Given these associated benefits, mindfulness meditation has the potential to facilitate academic leadership by reducing some of what can hurt good leadership (stress, switching costs, cognitive fatigue) and facilitating what might help (improvements in attentional control and better engagement with others).

Conclusions

As I mentioned at the outset, I wrote this article from the perspective of a faculty member at large research university, but I think the ideas apply to higher education roles in general. But it’s important to remember that mindfulness is not a panacea or a secret weapon. Mindfulness will not make you a better leader, a better teacher, a better scholar, or a better scientist. Mindful leaders may not always be the best leaders.

But the practice of mindfulness and the cultivation of a mindful state has been shown to reduce stress and improve some basic cognitive tasks that contribute to effective leadership. I find mindfulness meditation to be an important part of my day and an important part of my role as a professor, a teacher, a scientist, and an academic leader.  I think it can be an important part of a person’s work and life.

References

Arrington, C. M., & Logan, G. D. (2004). The cost of a voluntary task switch. Psychological Science, 15(9), 610–615.

Chambers, R., Lo, B. C. Y., & Allen, N. B. (2008). The Impact of Intensive Mindfulness Training on Attentional Control, Cognitive Style, and Affect. Cognitive Therapy and Research, 32(3), 303–322.

Greenberg, J., Reiner, K., & Meiran, N. (2012). “Mind the Trap”: Mindfulness Practice Reduces Cognitive Rigidity. PloS One, 7(5), e36206.

Hülsheger, U. R., Alberts, H. J. E. M., Feinholdt, A., & Lang, J. W. B. (2013). Benefits of mindfulness at work: the role of mindfulness in emotion regulation, emotional exhaustion, and job satisfaction. The Journal of Applied Psychology, 98(2), 310–325.

Jha, A. P., Krompinger, J., & Baime, M. J. (2007). Mindfulness training modifies subsystems of attention. Cognitive, Affective & Behavioral Neuroscience, 7(2), 109–119.

Jha, A. P., Stanley, E. A., Kiyonaga, A., Wong, L., & Gelfand, L. (2010). Examining the protective effects of mindfulness training on working memory capacity and affective experience. Emotion , 10(1), 54–64.

Monsell, S. (2003). Task switching. Trends in Cognitive Sciences, 7(3), 134–140.

Nadler, R., Carswell, J. J., & Minda, J. P. (2020). Online Mindfulness Training Increases Well-Being, Trait Emotional Intelligence, and Workplace Competency Ratings: A Randomized Waitlist-Controlled Trial. Frontiers in Psychology, 11, 255.

Tversky, A., & Kahneman, D. (1974). Judgment under Uncertainty: Heuristics and Biases. Science, 185(4157), 1124–1131.
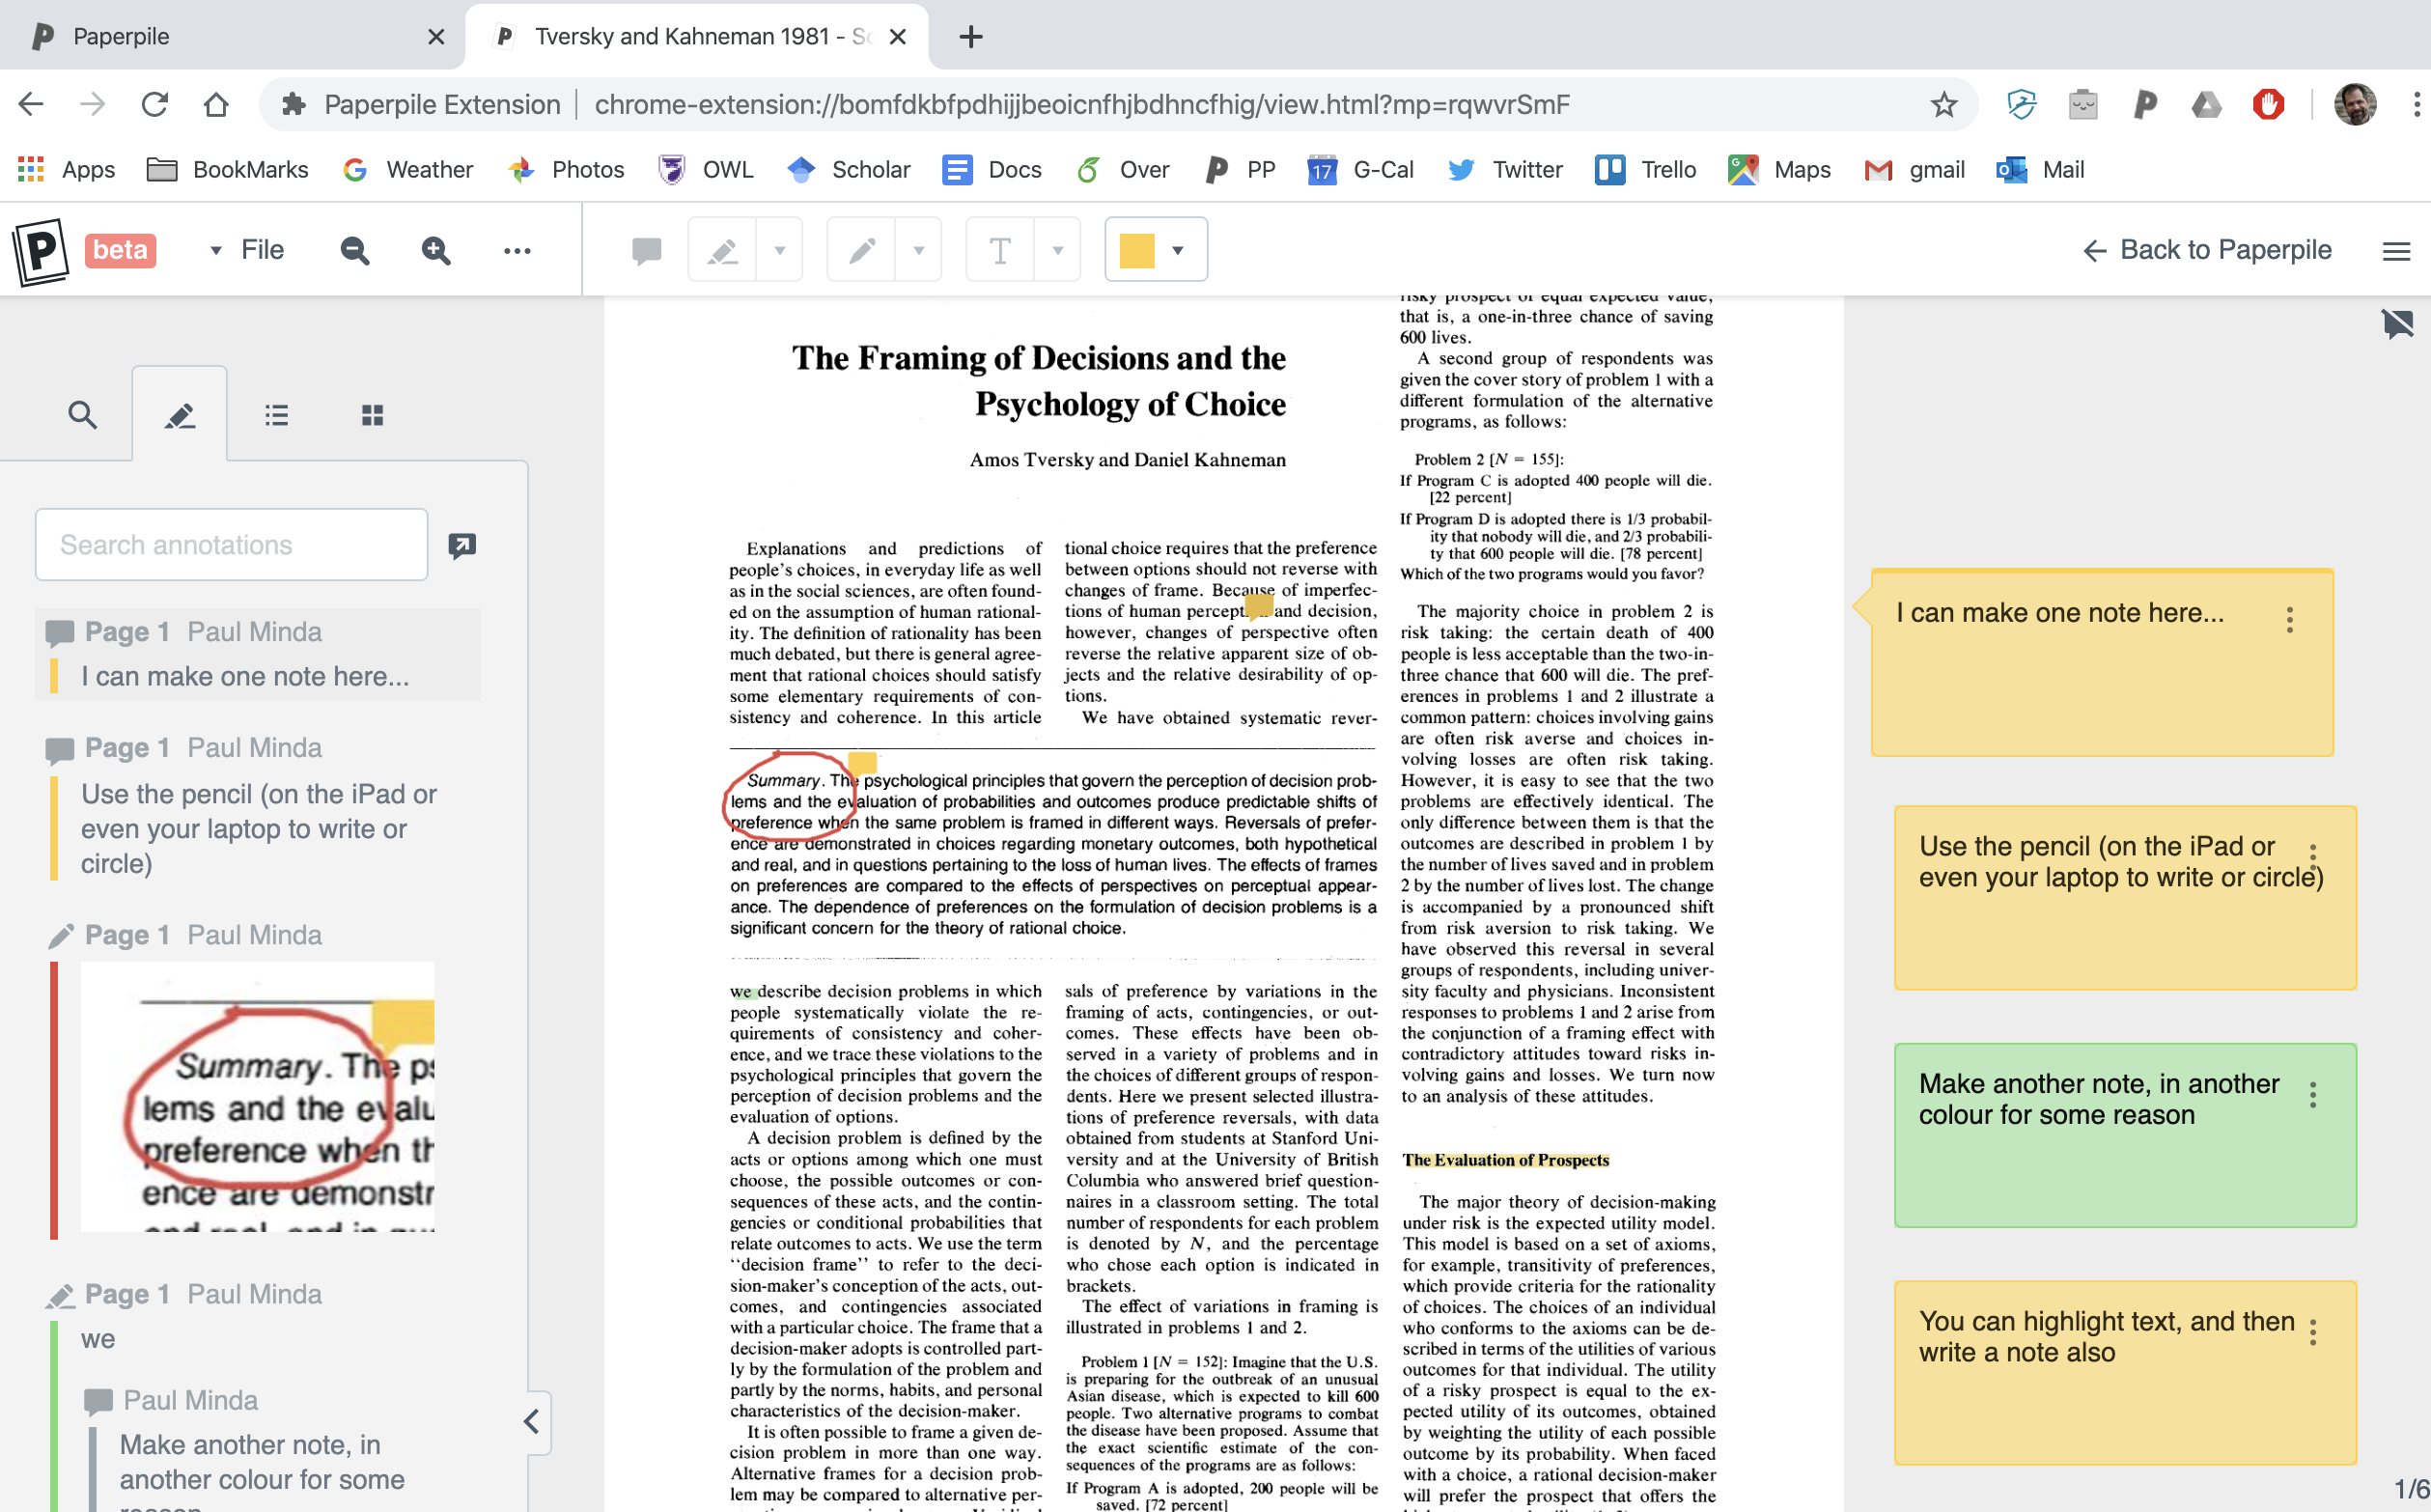
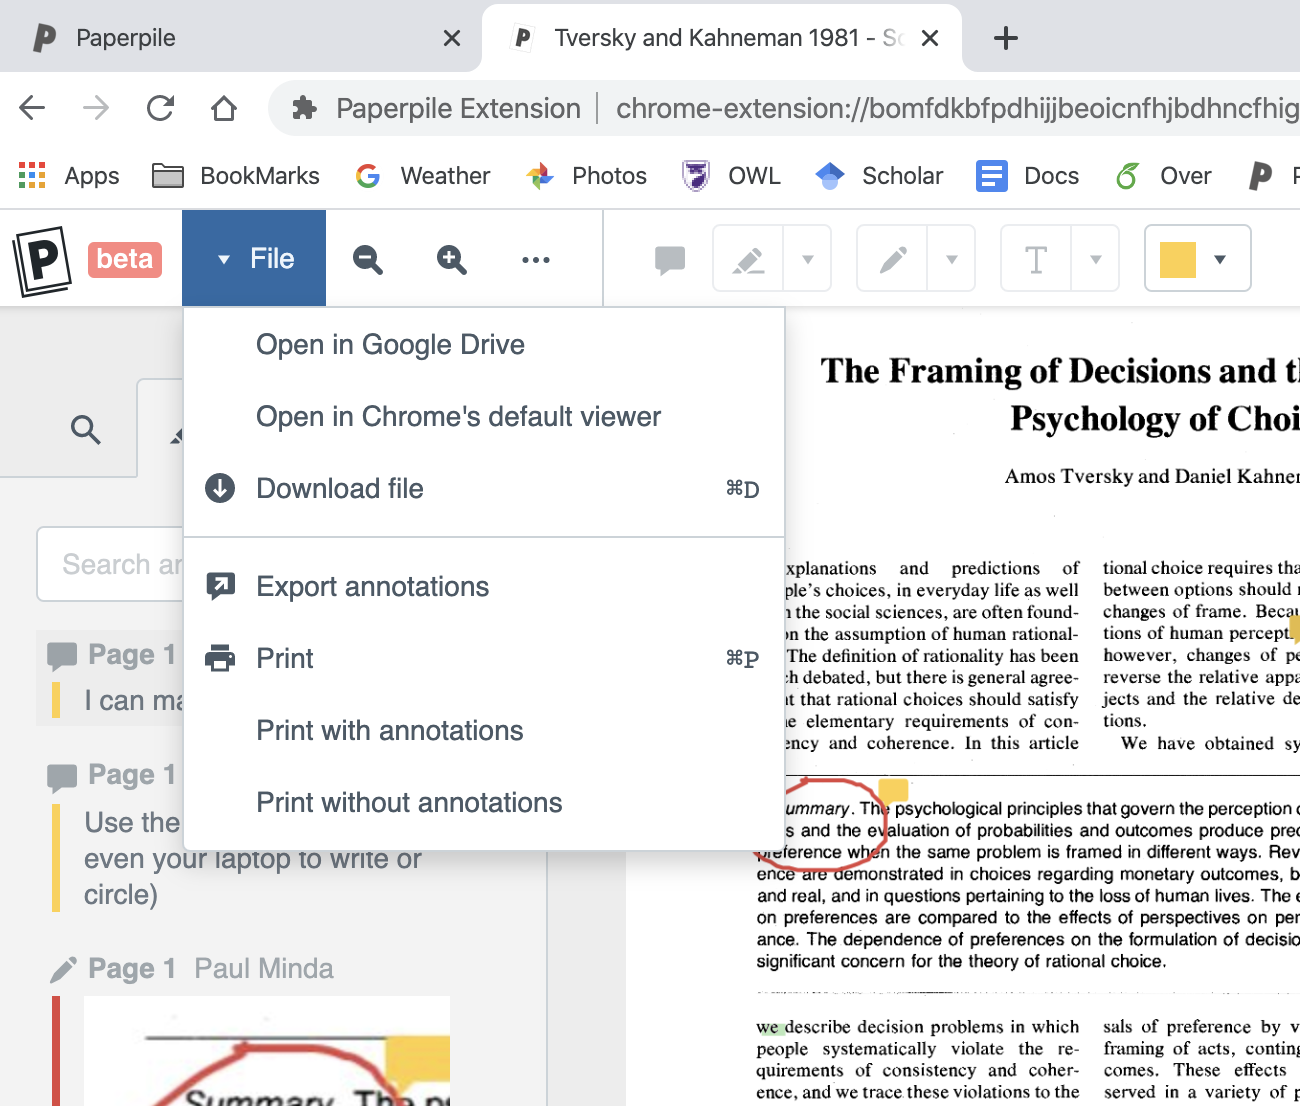
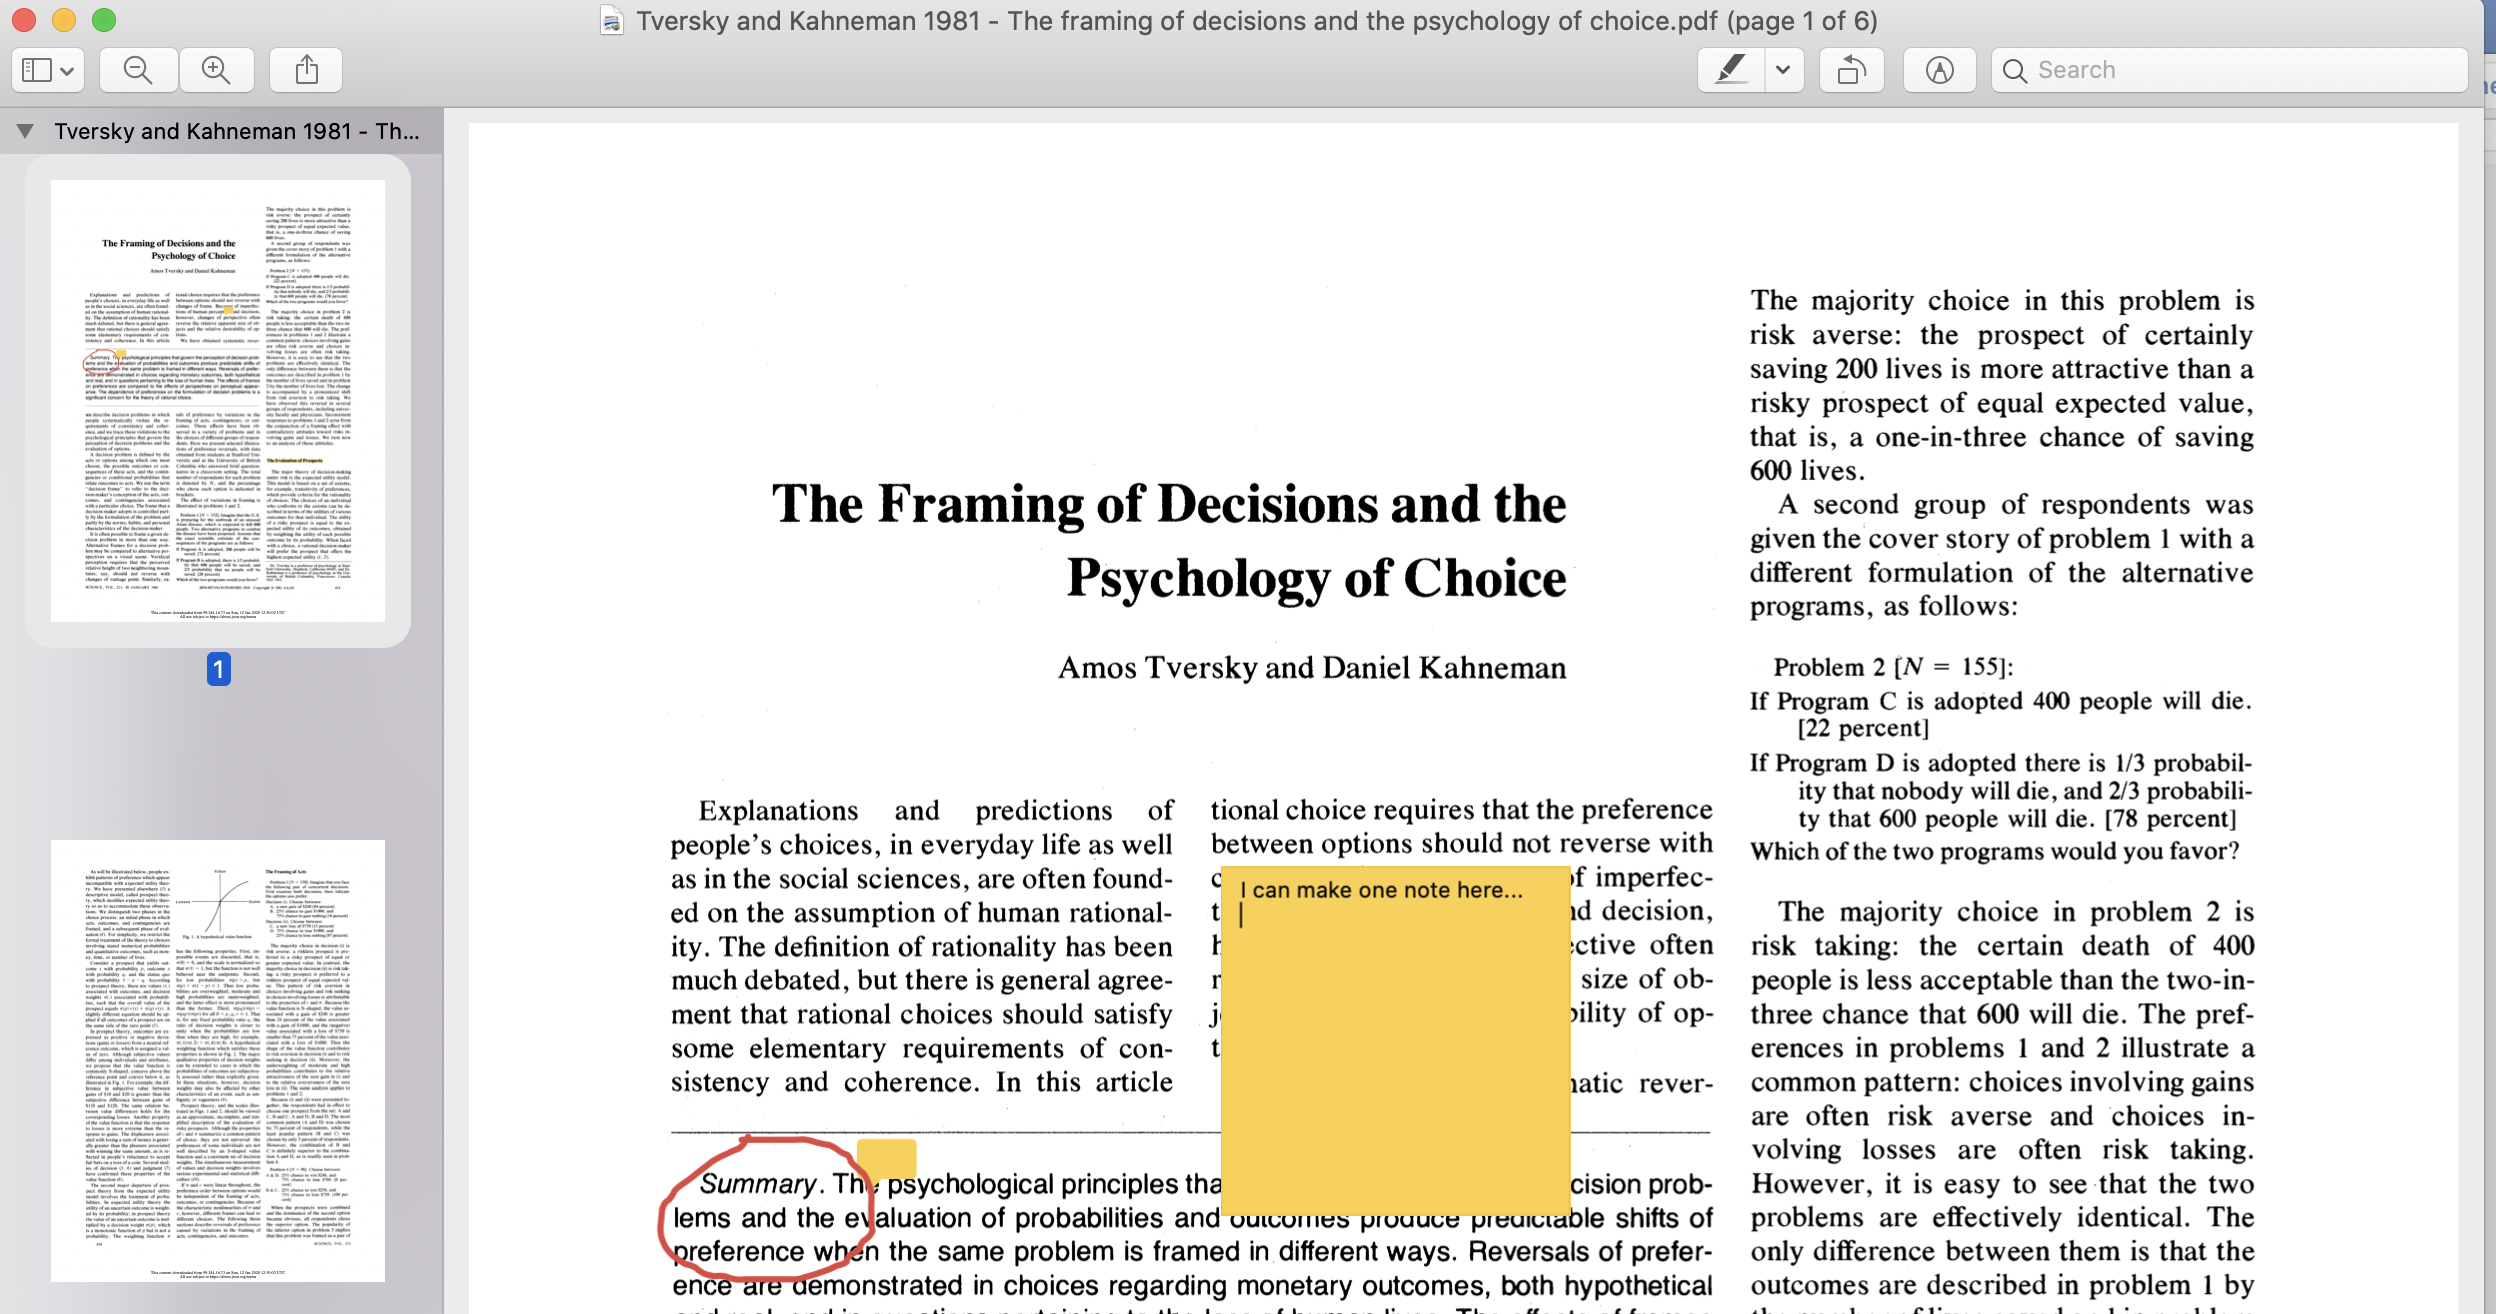
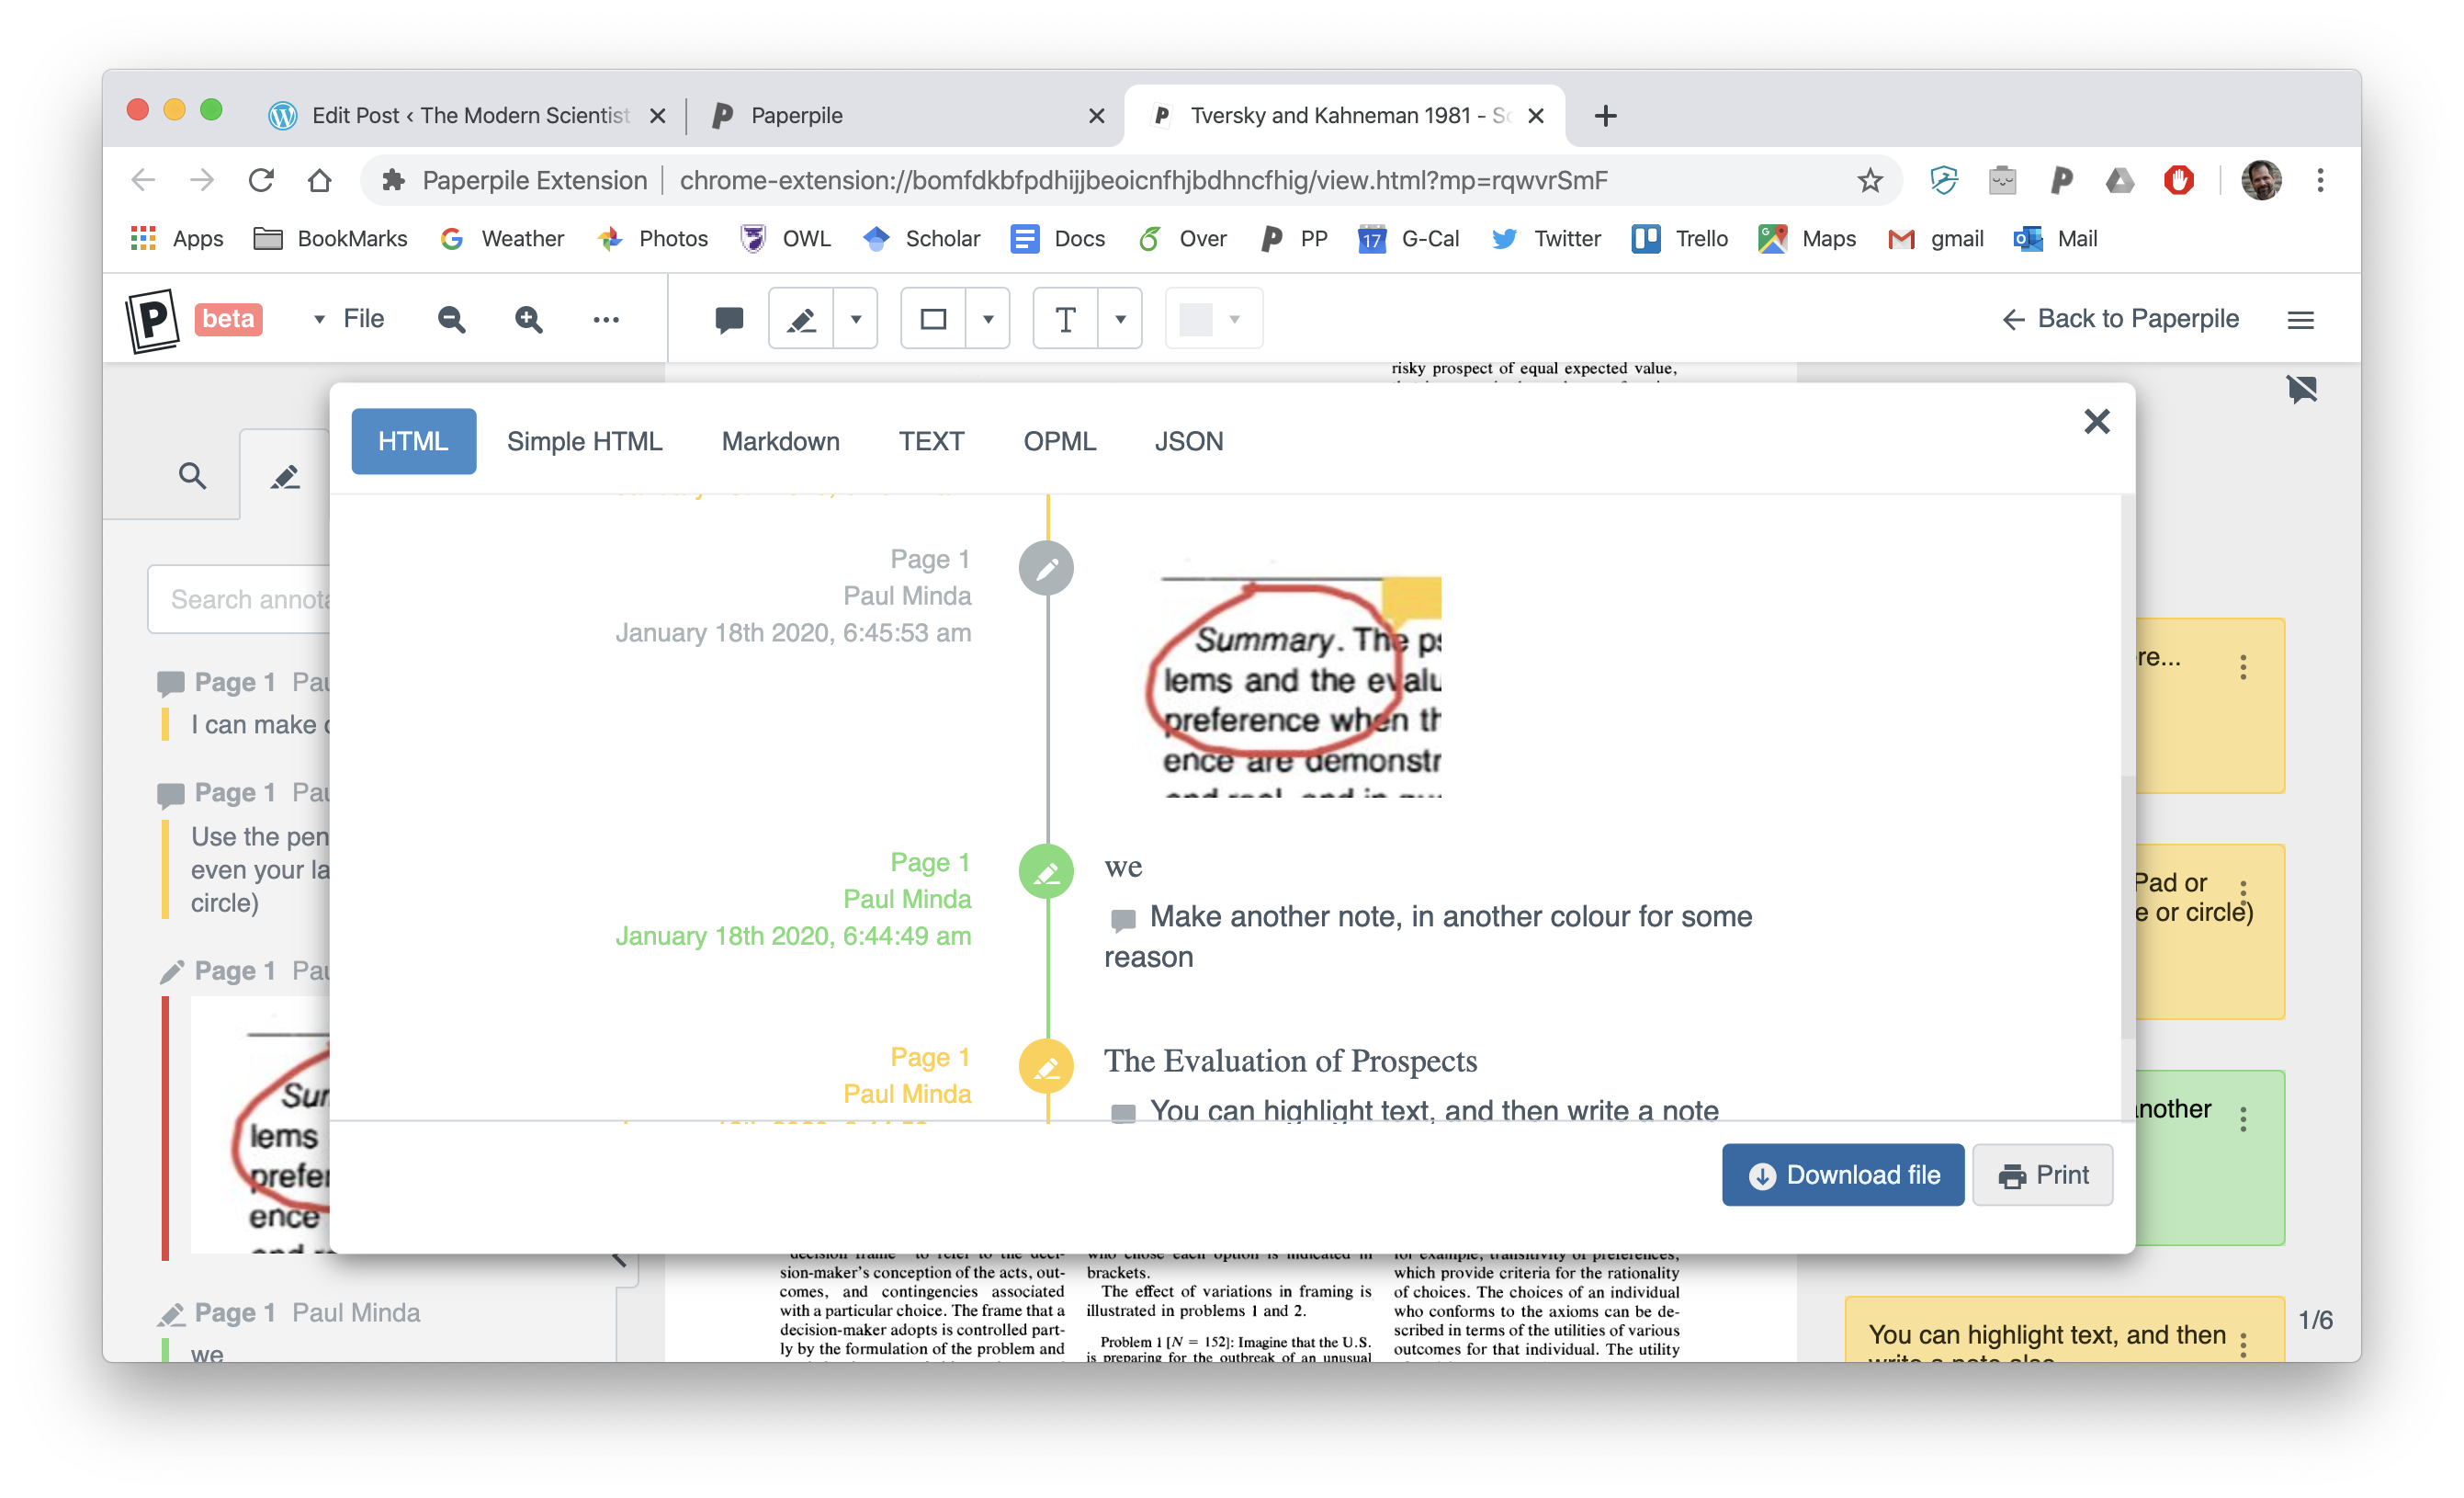
Psychology and the Art of Dishwasher Maintenance

The Importance of Knowing

It’s useful and powerful to know how something works. The cliché that “knowledge is power” may be a common and overused expression but that does not mean it is inaccurate.  Let me illustrate this idea with a story from a different area. I use this rhetorical device often, by the way. I frequently try to illustrate one idea with an analogy from another area. It’s probably a result of being a professor and lecturer for so many years. I try to show the connection between concepts and different examples. It can be helpful and can aid understanding. It can also be an annoying habit.

My analogy has to do with a dishwasher appliance. I remember the first time I figured out how to repair the dishwasher in my kitchen. It’s kind of a mystery how the dishwasher even works, because you never see it working (unless you do this). You just load the dishes, add the detergent, close the door, and start the machine. It runs its cycle out of direct view and when the washing cycle is finished, clean dishes emerge. So there’s an input, some internal state where something happens, and an output. We know what happens, but not exactly how it happens. We usually study psychology and cognition in the same way. We can know a lot about what’s going in and what’s coming out. We don’t know as much about what’s going in inside because we can’t directly observe it. But we can make inferences about what’s happening based on the function.

The Dishwasher Metaphor of the Mind

So let’s use this idea for bit. Let’s call it the “dishwasher metaphor“. The dishwasher metaphor for the mind assumes that we can observe the inputs and outputs of psychological processes, but not their internal states. We can make guesses about how the dishwasher achieves its primary function of creating clean dishes based on what we can observe about the input and output. We can also make guesses about the dishwasher’s functions by taking a look at a dishwasher that is not running and examining the parts. We also can make guesses about the dishwasher’s functions by observing what happens when it is not operating properly. And we can even make guesses about the dishwasher’s functions by experimenting with changing the input, changing how we load the dishes for example, and observing how that might affect the outputs. But most of this is careful, systematic guessing. We can’t actually observe the internal behaviour of the dishwasher. It’s mostly hidden from our view, impenetrable. Psychological science turns out to be a lot like trying to figure out how the dishwasher works. For better or worse, science often involves careful, systematic guessing

Fixing the Broken Dishwasher

The dishwasher in my house was a pretty standard early 2000s model by Whirlpool, though sold under the KitchenAid brand. It worked really well for years, but at some point, I started to notice that the dishes weren’t getting as clean as they used to. Not knowing what else to do, I tried to clean it by running it empty. This didn’t help. It seemed like water was not getting to the top rack. And indeed if I opened it up while it was running I could try to get an idea of what was going on. Opening stops the water but you can catch a glimpse of where the water is being sprayed. When I did this, I could observe that there was little or no water being sprayed out of the top sprayer arm. So now I had the beginnings of a theory of what was wrong, and I could begin testing hypotheses about this to determine how to fix it. What’s more, this hypothesis testing also helped to enrich my understanding of how the dishwasher actually worked.

Like any good scientist, I consulted the literature. In this case, YouTube and do-it-yourself websites. According to the literature, several things can affect the ability of the water to circulate. The pump is one of them. The pump helps to fill the unit with water and also to push the water around the unit at high enough velocity to wash the dishes. So if the pump was not operating correctly, the water would not be able to be pushed around and would not clean the dishes. But that’s not easy to service and also, if the pump were malfunctioning, it would not be filling or draining at all. So I reasoned that it must be something else.

There are other mechanisms and operations that could be failing and therefore restricting the water flow within the dishwasher. And the most probable cause was that something was clogging the filter that is supposed to catch particles from entering the pump or drain. It turns out that there’s a small wire screen underneath some of the sprayer arms. And attached to that is a small chopping blade that can chop and macerate food particles to ensure that they don’t clog the screen. But after a while, small particles can still build up around it and stop it from spinning, which stops the blades from chopping, which lets more food particles build up, which eventually restricts the flow of water, which means there’s not enough pressure to force water to the top level, which means there’s not enough water cleaning the dishes on the top, which leads the dishwasher to fail. Which is exactly what I had been observing. I was able to clean and service the chopper blade and screen and even installed a replacement. Knowing how the dishwasher works allowed me to keep a closer eye on that part, cleaning it more often. Knowing how the dishwasher worked gave me some insight into how to get cleaner dishes. Knowledge, in this case, was a powerful thing.

Trying to study what you can’t see

And that’s the point that I’m trying to make with the dishwasher metaphor.  We don’t necessarily need to understand how it works to know that it’s doing its job. We don’t need to understand how it works to use it. And it’s not easy to figure it out, since we can’t observe the internal state. But knowing how it works, and reading about how others have figured out how it works, can give you an insight into how the the processes work. And knowing how the processes work can give you and insight into how you might improve the operation, how you can avoid getting dirty dishes.

Levels of Dishwasher Analysis

This is just one example, of course and just a metaphor, but it illustrates how we can study something we can’t quite see. Sometimes knowing how something works can help in the operation and the use of that thing. More importantly, this metaphor can help to explain another theory of how we explain and study something. I am going to use this metaphor in a slightly different way and then we’ll put the metaphor away. Just like we put away the clean dishes. They are there in the cupboard, still retaining the effects of the cleaning process, ready to be brought back out again and used: a memory of the cleaning process.

Three ways to explain things

I think we can agree that there are different ways to clean dishes, different kinds of dishwashers, and different steps that you can take when washing the dishes. For washing dishes, I would argue that we have three different levels that we can use to explain and study things. First there is a basic function of what we want to accomplish, the function of cleaning dishes. This is abstract and does not specify who or how it happens, just that it does. And because it’s a function, we can think about it as almost computational in nature. We don’t even need to have physical dishes to understand this function, just that we are taking some input (the dirty dishes) and specifying an output (clean dishes). Then there is a less abstract level that specifies a process for how to achieve the abstract function. For example, a dishwashing process should first rinses off food, use detergent to remove grease and oils, rinse off the detergent, and then maybe dry the dishes. This is a specific series of steps that will accomplish the computation above. It’s not the only possible aeries of steps, but it’s one that works. And because this is like a recipe, we can call it an algorithm. When you follow these steps, you will obtain the desired results. There is also an even more specific level. We can imagine that there are many ways to build a system to carry out these steps in the algorithm so that they produce the desired computation. My Whirlpool dishwasher is one way to implement these steps. But another model of dishwasher might carry them out in a slightly different way. And the same steps could also be carried out by a completely different system (like on of my kids washing dishes by hand, for example). The function is the same (dirty dishes –> clean dishes) and the steps are the same (rinse, wash, rinse again, dry) but the steps are implemented by different system (one mechanical and the other biological). One simple task but there are three ways to understand and explain it.

David Marr and Levels of Analysis

My dishwasher metaphor is pretty simple and kind of silly. But there are theorists who have discussed more seriously the different ways to know and explain psychology. Our behaviour is one, observable aspect of this picture. Just as the dishwasher makes clean dishes, we behave to make things happen in our world. That’s a function. And just like the dishwasher, there are more that one way to carry out a function, and there are also more one way to build a system to carry out the function. The late and brilliant vision scientist David Marr argued that when trying to understand behaviour, the mind, and the brain, scientists can design explanations and theories at three levels. We refer to these as Marr’s Levels of Analysis (Marr, 1982). Marr worked on understanding vision. And vision is something that, like the dishwasher, can be studied at three different levels.

Untitled

Marr described the Computational Level as an abstract level of analysis that examines the actual function of the process. We can study what vision does (like enabling navigation, identifying objects, even extracting regularly occurring features from the world) at this level and this might not need to be as concerned with the actual steps or biology of vision. But at Marr’s Algorithmic Level, we look to identify the steps in the process. For example, if we want to study how objects are identified visually, we specify the initial extraction of edges, the way the edges and contours are combined, and the how these visual inputs to the system are related to knowledge. At this level, just as in the dishwasher metaphor, we are looking at species of steps but have not specified how those steps might be implemented. That examination would be done at the Implementation Level where we would study the visual system’s biological workings. And just like with the dishwasher metaphor, the same steps can be implemented by different systems (biological vision vs computer visions, for example). Marr’s theory about how we explain things has been very influential in my thinking and in psychology in general. It gives us a way to know about something and study somethings at different levels of abstraction and this can lead to insights about biology, cognitions, and behaviour.

And so it is with the study of cognitive psychology. Knowing something about how your mind works, how your brain works, and how the brain and mind interact with the environment to generate behaviours can help you make better decisions and solve problems more effectively. Knowing something about how the brain and mind work can help you understand why some things are easy to remember and others are difficult. In short, if you want to understand why people—and you—behave a certain why, you need to understand how they think. And if you want to understand how people think, you need to understand the basic principles of cognitive psychology, cognitive science, and cognitive neuroscience.

Reference

Marr, D. Vision: A Computational Investigation into the Human Representation and Processing of Visual Information (WH Freeman, San Fransisco, 1982).

Ice-Storm Pumpkin Muffins

February always brings terrible weather to Ontario and 2019 is no exception. February 6 saw the city (London, ON) nearly shut down by an ice storm. Schools were closed, the University closed early, and we all stayed home. This was great! We were nearing the completion of a kitchen renovation, it gave us time to unpack a few things and get the kitchen back in working order.

So I decided to bake a batch of pumpkin muffins. Naturally, I posted the picture on Twitter and Instagram and was asked for the recipe so I have to oblige.

Dyv7bgvU8AAkJfI

Hot and fresh from the oven in a newly-renovated kitchen

I have been baking these for at least 10 years and they were the runner up in the muffin category in 2016 at the Ilderton Fair, which is one of the best regional fairs in Ontario. Ilderton, Ontario, for those who don’t know, happens to the home of Scott Moir and the home ice for the most famous Olympic ice dancers in history, Scott Moir and Tessa Virtue. In fact, Scott was at the beer tent when I went to pick up my blue ribbon. Obviously, I assumed that he and I were kind of kindred spirits, him with all the Olympic gold medals and me with a second place muffin prize (not to mention the first place bread a few years earlier). He was busy, though, so he never got a chance to congratulate me on the muffins. Next time, Scott!

So here’s my recipe, I hope they turn out well for you.

Pumpkin Muffins

Makes 12 muffins or one loaf of pumpkin bread.

Preheat oven to 375°

Mix together in a large bowl:

  • 1 3/4 cup all purpose flour (I use Arva Flour)
  • 1 tsp baking soda
  • 1 tsp baking powder
  • 1/2 tsp salt
  • 1 tsp cinnamon
  • 1/2 tsp ground clove
  • 1/2 tsp ground ginger
  • 1/2 tsp ground nutmeg

Whisk together in another bowl:

  • 2 eggs (substitute an extra 1/2 cup pumpkin if you want ’em vegan)
  • 3/4 cup neutral flavour oil (e.g. canola)
  • 1 tsp vanilla

Then add:

  • 1 cup of brown sugar
  • 1 cup of unsweetened pumpkin puree (or any winter squash)

Add the wet ingredients to the dry ingredients in the larger bowl and stir together until just mixed. Don’t overdo it. Spoon into muffin tins that have been lined or greased. Just before baking, sprinkle the tops lightly with a mix of cinnamon and sugar.

bake at 375° for 18 minutes.

These are even better if you let them cool and cover with plastic wrap until the next day, the tops get sticky and irresistible.